File Info
| Exam | Managing Jira Projects for Data Center and Server Certification |
| Number | ACP-610 |
| File Name | Atlassian.ACP-610.VCEplus.2023-11-23.41q.tqb |
| Size | 916 KB |
| Posted | Nov 23, 2023 |
| Download | Atlassian.ACP-610.VCEplus.2023-11-23.41q.tqb |
How to open VCEX & EXAM Files?
Files with VCEX & EXAM extensions can be opened by ProfExam Simulator.
Coupon: MASTEREXAM
With discount: 20%


Demo Questions
Question 1
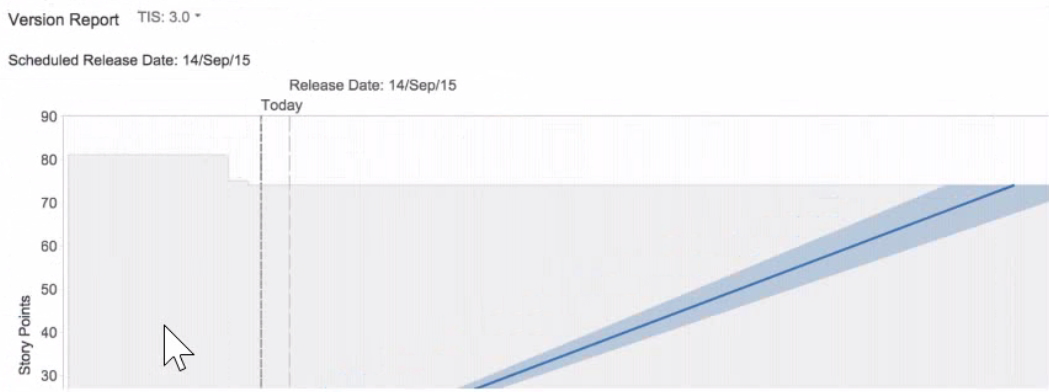
Review the Version Report:
- The release date that has been added to this version should be reconsidered.
- More than 20 story points were burned when this chart was reviewed in July 2015.
- Only three issues have been completed in the version, so a predicted end date is not possible.
- The team should use time-based estimation, not story points.
- There are too many unestimated issues in this version, so any predictions are inaccurate.
Correct answer: B
Question 2
You need to display data on a dashboard that shows the correlation between the following:
- the number of days that issues have been open
- the number of comments on the issues
- the number of participants on the issues
Identify the single gadget that meets these requirements.
- Heat Map
- Bubble Chart
- Activity Stream
- Issue Statistics
- Voted Issues
Correct answer: B
Question 3
Darren wants to analyze the performance of his support teams. Less time in the Waiting for Support status indicates optimal team performance. The report should provide a way to dynamically analyze not only specific days but also specific time frames. Which report provides this information?
- Average Age Report
- Recently Created Issues Report
- Created vs Resolved Issues Report
- Control Chart
- Resolution Time Report
Correct answer: D
Explanation:
A Control Chart is the best report to provide the information that Darren wants. A Control Chart shows the cycle time or lead time for your team's issues, broken down by the time spent in each status. It helps you identify whether data from the current process can be used to determine future performance. Less time in the Waiting for Support status indicates optimal team performance, as it means that the issues are being addressed promptly and efficiently. A Control Chart also provides a way to dynamically analyze not only specific days but also specific time frames, by using the date range selector and the zoom feature. You can also filter the chart by issue type, assignee, label, or any other field.Reference:Managing Jira Projects Data Center and Server: Certification Bundle, [Control Chart | Jira Software Cloud] A Control Chart is the best report to provide the information that Darren wants. A Control Chart shows the cycle time or lead time for your team's issues, broken down by the time spent in each status. It helps you identify whether data from the current process can be used to determine future performance. Less time in the Waiting for Support status indicates optimal team performance, as it means that the issues are being addressed promptly and efficiently. A Control Chart also provides a way to dynamically analyze not only specific days but also specific time frames, by using the date range selector and the zoom feature. You can also filter the chart by issue type, assignee, label, or any other field.Reference:Managing Jira Projects Data Center and Server: Certification Bundle, [Control Chart | Jira Software Cloud]

