File Info
| Exam | Implementing Cisco Enterprise Network Core Technologies (350-401 ENCOR) |
| Number | 350-401 |
| File Name | Cisco.350-401.NewDumps.2021-05-25.100q.vcex |
| Size | 8 MB |
| Posted | May 25, 2021 |
| Download | Cisco.350-401.NewDumps.2021-05-25.100q.vcex |
How to open VCEX & EXAM Files?
Files with VCEX & EXAM extensions can be opened by ProfExam Simulator.
Coupon: MASTEREXAM
With discount: 20%


Demo Questions
Question 1
You issue the following commands on a Cisco router:
RouterA#debug condition interface serial 0/0
RouterA#debug condition interface serial 0/1
RouterA#debug condition username RouterB
RouterA#debug ppp authentication
Which of the following PPP authentication debugging messages will be displayed on RouterA? (Select the best answer.)
- only messages that contain the RouterB user name
- only messages that arrive on the Serial 0/0 interface
- only messages that arrive on the Serial 0/1 interface
- messages that contain the RouterB user name or that arrive on either specified interface
Correct answer: D
Explanation:
Debug messages that contain the RouterB user name and that arrive on either the Serial 0/0 interface or the Serial 0/1 interface would be displayed if you were to issue the commands in this scenario on a Cisco router. The debug condition command is used to enable restrictions on the data that the debugging process displays. If no conditions are specified, all output from enabled debugging commands will be displayed. You can configure a series of debug conditions, any one of which will cause debug messages to display when a match occurs. In order to display the output, the debugging process need only match one of the specified conditions, not all of them. The debug condition interfaceinterface command limits debug messaging output to only enabled debugging that applies to the specified interface. For example, if you were to issue the debug condition interface serial 0/0 command followed by the debug ppp authentication command in this scenario, the debug output would consist of PointtoPoint Protocol (PPP) authentication messages, but only if those messages also apply to the router’s Serial 0/0 interface. The debug output will not be limited to only one interface on RouterA in this scenario. Configuring a series of debug condition interface interface commands limits debug message output to the series of specified interfaces. The debug output need match only one of the interface conditions to be displayed. For example, you could issue the following commands on RouterA to ensure that PPP authentication debug messages that apply to either the Serial 0/0 interface or the Serial 0/1 interface are displayed on the router:RouterA#debug condition interface serial 0/0 RouterA#debug condition interface serial 0/1 RouterA#debug ppp authentication After issuing the commands above, you could further limit the PPP authentication debug output by issuing the no debug condition interface interface command. For example, issuing the no debug condition interface serial 0/0 command would remove the Serial 0/0 interface condition from the debugging output, which means that only PPP authentication messages that apply to the Serial 0/1 interface would be displayed. You can remove all interface conditions from debugging output by issuing the no debug condition interface all command. After that command is issued, all PPP authentication debugging messages would be displayed unless you also issued the no debug ppp authenticationcommand or the no debug all command. The debug output will not be limited to the user name RouterB, because you have also issued debug condition interface interface commands in this scenario. The debug condition {username username | called dialstring | callerdialstring} command enables you to limit the output of debugging messages by user name, calling party number, or called party number. Applying only one of those conditions to debugging output stops the output of debug messages on all interfaces. The router will then monitor each interface for a condition match. If a match occurs, debug messages will be displayed for that match. In this scenario, the debug condition username RouterB command will display output when an interface sends or receives a PPP authentication packet that contains the user name RouterB. However, because you have also issued the debug condition interface serial 0/0 command and the debug condition interface serial 0/1 command, PPP authentication messages that apply to either of those interfaces will be displayed even if the RouterB user name is not matched. You can determine which debug conditions are configured and which have been met on a Cisco device by issuing the show debug condition command from privileged EXEC mode. For example, the following output indicates that three conditions have been enabled on the router, but only the last two conditions have been matched so far: Based on the output above, you can determine that PPP authentication has occurred on RouterA’s Serial 0/1 interface and that the user name RouterB was used to perform the authentication. In addition, the user name RouterB triggered flags both on the Serial 0/1 interface and by the PPP session manager, possibly indicating that after debugging was configured, the connection between RouterA and RouterB went down and was then restored. Reference:Cisco: Cisco IOS Debug Command Reference, Release 12.2: Enabling Conditional Debugging Commands Debug messages that contain the RouterB user name and that arrive on either the Serial 0/0 interface or the Serial 0/1 interface would be displayed if you were to issue the commands in this scenario on a Cisco router. The debug condition command is used to enable restrictions on the data that the debugging process displays. If no conditions are specified, all output from enabled debugging commands will be displayed. You can configure a series of debug conditions, any one of which will cause debug messages to display when a match occurs. In order to display the output, the debugging process need only match one of the specified conditions, not all of them.
The debug condition interfaceinterface command limits debug messaging output to only enabled debugging that applies to the specified interface. For example, if you were to issue the debug condition interface serial 0/0 command followed by the debug ppp authentication command in this scenario, the debug output would consist of PointtoPoint Protocol (PPP) authentication messages, but only if those messages also apply to the router’s Serial 0/0 interface.
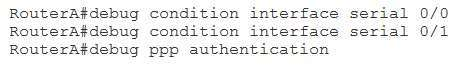
The debug output will not be limited to only one interface on RouterA in this scenario. Configuring a series of debug condition interface interface commands limits debug message output to the series of specified interfaces. The debug output need match only one of the interface conditions to be displayed. For example, you could issue the following commands on RouterA to ensure that PPP authentication debug messages that apply to either the Serial 0/0 interface or the Serial 0/1 interface are displayed on the router:
RouterA#debug condition interface serial 0/0
RouterA#debug condition interface serial 0/1
RouterA#debug ppp authentication
After issuing the commands above, you could further limit the PPP authentication debug output by issuing the no debug condition interface interface command. For example, issuing the no debug condition interface serial 0/0 command would remove the Serial 0/0 interface condition from the debugging output, which means that only PPP authentication messages that apply to the Serial 0/1 interface would be displayed. You can remove all interface conditions from debugging output by issuing the no debug condition interface all command. After that command is issued, all PPP authentication debugging messages would be displayed unless you also issued the no debug ppp authenticationcommand or the no debug all command.
The debug output will not be limited to the user name RouterB, because you have also issued debug condition interface interface commands in this scenario. The debug condition {username username | called dialstring | callerdialstring} command enables you to limit the output of debugging messages by user name, calling party number, or called party number. Applying only one of those conditions to debugging output stops the output of debug messages on all interfaces. The router will then monitor each interface for a condition match. If a match occurs, debug messages will be displayed for that match. In this scenario, the debug condition username RouterB command will display output when an interface sends or receives a PPP authentication packet that contains the user name RouterB. However, because you have also issued the debug condition interface serial 0/0 command and the debug condition interface serial 0/1 command, PPP authentication messages that apply to either of those interfaces will be displayed even if the RouterB user name is not matched.
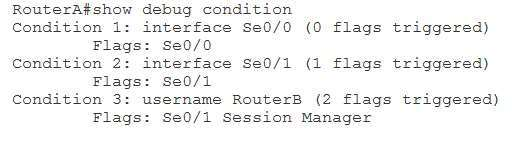
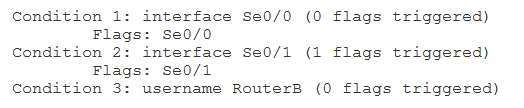
You can determine which debug conditions are configured and which have been met on a Cisco device by issuing the show debug condition command from privileged EXEC mode. For example, the following output indicates that three conditions have been enabled on the router, but only the last two conditions have been matched so far:
Based on the output above, you can determine that PPP authentication has occurred on RouterA’s Serial 0/1 interface and that the user name RouterB was used to perform the authentication. In addition, the user name RouterB triggered flags both on the Serial 0/1 interface and by the PPP session manager, possibly indicating that after debugging was configured, the connection between RouterA and RouterB went down and was then restored.
Reference:
Cisco: Cisco IOS Debug Command Reference, Release 12.2: Enabling Conditional Debugging Commands
Question 2
Which of the following ping command options should be enabled if you want to determine the MTU size that a given connection supports? (Select the best answer.)
- the IPv4 donotfragment bit
- a number of pings greater than five
- a datagram size greater than 1,500 bytes
- a timeout value greater than two seconds
Correct answer: A
Explanation:
The IP version 4 (IPv4) donotfragment bit, or DF bit, is the ping command option that should be enabled if you want to determine the maximum transmission unit (MTU) size that a given connection supports. By default, packet fragmentation is used to enable oversized packets to traverse the network in chunks that are smaller than the configured MTU. The DF bit configures the ping command to attempt to send packets of a given size without fragmentation. By repeatedly pinging a destination device with smaller and smaller datagram sizes, you can determine the MTU. The ping command supports the ability to modify the size of the datagram that it transmits as well as the ability to enable the DF bit, which is disabled by default. You can configure extended ping features either by issuing the ping command without parameters, which causes the ping command to display a series of configuration prompts, or by specifying parameters on the command line along with the ping command. For example, the ping 192.168.1.1 size 1500 dfbit command configures an extended ping with a destination IP address of 192.168.1.1, a datagram size of 1,500 bytes, and an enabled DF bit. On a connection with an MTU of 1,500 bytes, this ping succeeds, as shown in the following output: Based on the output, you can determine that the ping succeeded. You can also determine that the DF bit is, indeed, enabled. However, issuing the ping 192.168.1.1 size 1501 dfbit command on the same device results in a failure, as shown in the following output: In the output above, issuing the ping 192.168.1.1 size 1501 dfbit command results in a ping failure because the MTU is configured to 1,500 bytes and the DF bit is set. If you were to issue the same command without the dfbit parameter, the ping would succeed because the ping command is allowing the datagram to be fragmented, as shown in the following output: You do not need to explicitly set the datagram size to 1,500 bytes in this scenario. By default, Cisco devices are configured with a system MTU of 1,500 bytes. Therefore, the ping might succeed, providing no indication of a configured MTU. In order to test the MTU, you should set the DF bit and test a high MTU. You should then methodically lower the datagram size that you test with the DF bit enabled until the ping succeeds. You do not need to adjust the number of pings from the default value of five. In addition, you do not need to adjust the default timeout value of two seconds. Neither of these values help you determine the configured MTU. Reference:Cisco: Using the Extended ping and Extended traceroute Commands: The Extended ping Command The IP version 4 (IPv4) donotfragment bit, or DF bit, is the ping command option that should be enabled if you want to determine the maximum transmission unit (MTU) size that a given connection supports. By default, packet fragmentation is used to enable oversized packets to traverse the network in chunks that are smaller than the configured MTU. The DF bit configures the ping command to attempt to send packets of a given size without fragmentation. By repeatedly pinging a destination device with smaller and smaller datagram sizes, you can determine the MTU.
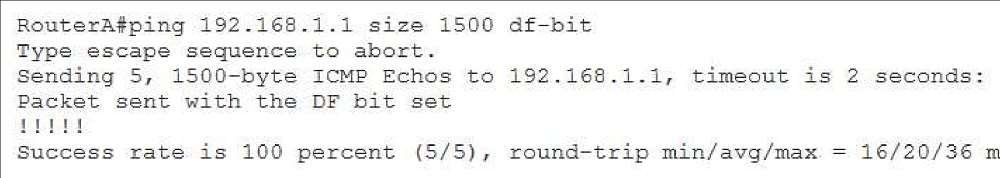
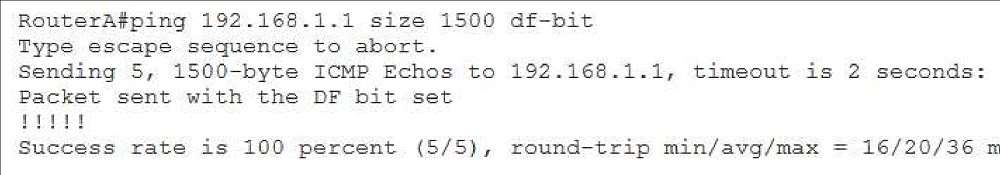
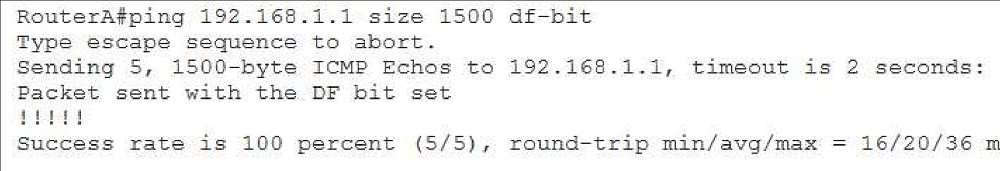
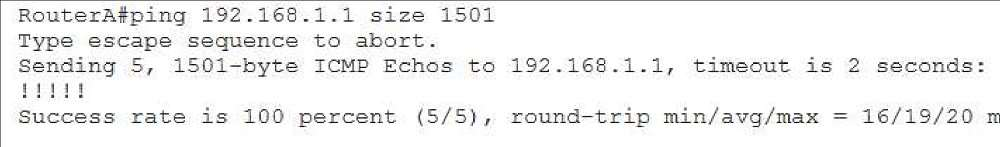
The ping command supports the ability to modify the size of the datagram that it transmits as well as the ability to enable the DF bit, which is disabled by default. You can configure extended ping features either by issuing the ping command without parameters, which causes the ping command to display a series of configuration prompts, or by specifying parameters on the command line along with the ping command. For example, the ping 192.168.1.1 size 1500 dfbit command configures an extended ping with a destination IP address of 192.168.1.1, a datagram size of 1,500 bytes, and an enabled DF bit. On a connection with an MTU of 1,500 bytes, this ping succeeds, as shown in the following output:
Based on the output, you can determine that the ping succeeded. You can also determine that the DF bit is, indeed, enabled.
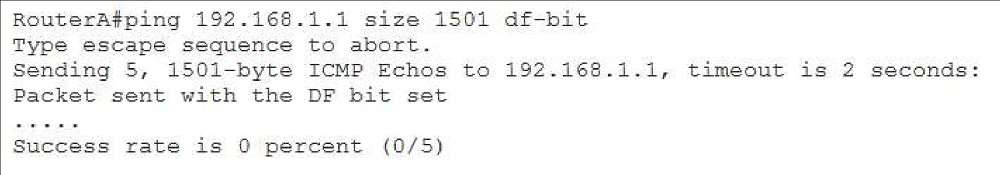
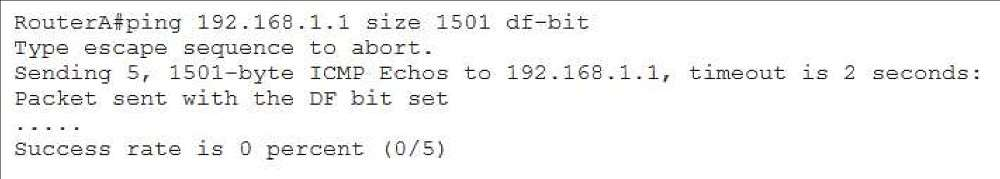
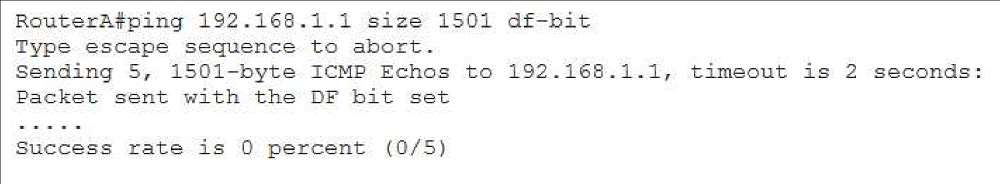
However, issuing the ping 192.168.1.1 size 1501 dfbit command on the same device results in a failure, as shown in the following output:
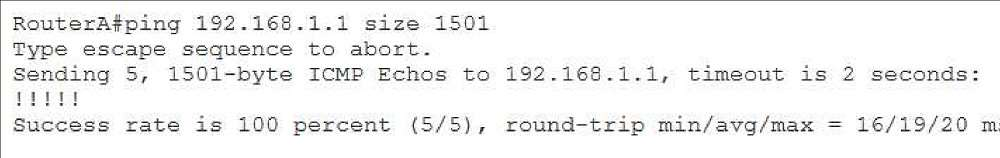
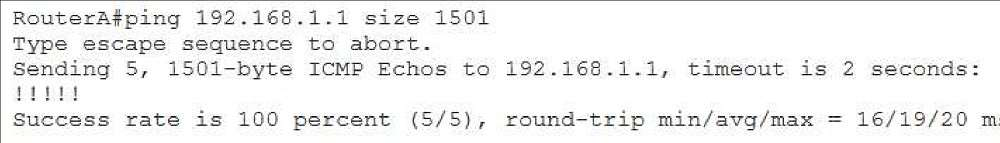
In the output above, issuing the ping 192.168.1.1 size 1501 dfbit command results in a ping failure because the MTU is configured to 1,500 bytes and the DF bit is set. If you were to issue the same command without the dfbit parameter, the ping would succeed because the ping command is allowing the datagram to be fragmented, as shown in the following output:
You do not need to explicitly set the datagram size to 1,500 bytes in this scenario. By default, Cisco devices are configured with a system MTU of 1,500 bytes. Therefore, the ping might succeed, providing no indication of a configured MTU. In order to test the MTU, you should set the DF bit and test a high MTU.
You should then methodically lower the datagram size that you test with the DF bit enabled until the ping succeeds.
You do not need to adjust the number of pings from the default value of five. In addition, you do not need to adjust the default timeout value of two seconds. Neither of these values help you determine the configured MTU.
Reference:
Cisco: Using the Extended ping and Extended traceroute Commands: The Extended ping Command
Question 3
You issue the debug ppp authentication command on RouterA. RouterA’s Serial 0/0 interface is connected to RouterB.
RouterA’s Serial 0/1 interface is connected to RouterC.
You issue the no shutdown command on all interfaces and note that every interface has entered the up state.
Next, you issue the show debug condition command on RouterA and receive the following output:
Which of the following statements is true? (Select the best answer.)
- A debug condition has been met on the Serial 0/0 interface.
- A debug condition has been met on the Serial 0/1 interface.
- A debug condition has been met in which the user name is RouterB.
- All debug conditions in this scenario have been met.
- None of the debug conditions in this scenario have been met.
Correct answer: B
Explanation:
Based on the output in this scenario, you can determine that a PointtoPoint Protocol (PPP) authentication debug condition has been met on the Serial 0/1 interface of RouterA, which is the interface that is connected to RouterC. The debug condition command is used to enable restrictions on the data that the debugging process displays. If no conditions are specified, all output from enabled debugging commands will be displayed. You can configure a series of debug conditions, any one of which will cause debug messages to display when a match occurs. In order to display the output, the debugging process need only match one of the specified conditions, not all of them. You can determine which debug conditions are configured and which have been met on a Cisco device by issuing the show debug condition command from privileged EXEC mode. For example, the following output indicates that three conditions have been enabled on the router, but only one condition has been matched so far: Because you have enabled PPP authentication debugging in this scenario, you can determine that PPP authentication has occurred on RouterA’s Serial 0/1 interface. In addition, you can determine that the user name RouterB has not been triggered. Therefore, no PPP authentication has occurred on RouterA that includes the user name of RouterB. The debug condition interfaceinterface command limits debug messaging output to only enabled debugging that applies to the specified interface. For example, if you were to issue the debug condition interface serial 0/0 command followed by the debug ppp authentication command in this scenario, the debug output would consist of PPP authentication messages, but only if those messages also apply to the router’s Serial 0/0 interface. Configuring a series of debug condition interface interface commands limits debug message output to the series of specified interfaces. The debug output need match only one of the interface conditions to be displayed. For example, you could issue the following commands on RouterA to ensure that PPP authentication debug messages that apply to either the Serial 0/0 interface or the Serial 0/1 interface are displayed on the router: After issuing the commands above, you could further limit the PPP authentication debug output by issuing the no debug condition interface interface command. For example, issuing the no debug condition interface serial 0/0 command would remove the Serial 0/0 interface condition from the debugging output, which means that only PPP authentication messages that apply to the Serial 0/1 interface would be displayed. You can remove all interface conditions from debugging output by issuing the no debug condition interface all command. After that command is issued, all PPP authentication debugging messages would be displayed unless you also issued the no debug ppp authenticationcommand or the no debug all command. The debug condition {username username | called dialstring | callerdialstring} command enables you to limit the output of debugging messages by user name, calling party number, or called party number. Applying only one of those conditions to debugging output stops the output of debug messages on all interfaces. The router will then monitor each interface for a condition match. If a match occurs, debug messages will be displayed for that match. In this scenario, the debug condition username RouterB command will display output when an interface sends or receives a PPP authentication packet that contains the user name RouterB. However, because you have also issued the debug condition interface serial 0/0 command and the debug condition interface serial 0/1 command, PPP authentication messages that apply to either of those interfaces will be displayed even if the RouterB user name is not matched. Reference:Cisco: Cisco IOS Debug Command Reference, Release 12.2: Enabling Conditional Debugging Commands Based on the output in this scenario, you can determine that a PointtoPoint Protocol (PPP) authentication debug condition has been met on the Serial 0/1 interface of RouterA, which is the interface that is connected to RouterC. The debug condition command is used to enable restrictions on the data that the debugging process displays. If no conditions are specified, all output from enabled debugging commands will be displayed. You can configure a series of debug conditions, any one of which will cause debug messages to display when a match occurs. In order to display the output, the debugging process need only match one of the specified conditions, not all of them.
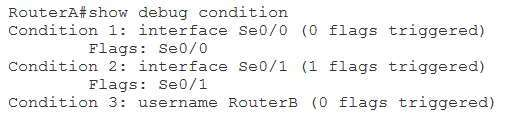
You can determine which debug conditions are configured and which have been met on a Cisco device by issuing the show debug condition command from privileged EXEC mode. For example, the following output indicates that three conditions have been enabled on the router, but only one condition has been matched so far:
Because you have enabled PPP authentication debugging in this scenario, you can determine that PPP authentication has occurred on RouterA’s Serial 0/1 interface. In addition, you can determine that the user name RouterB has not been triggered. Therefore, no PPP authentication has occurred on RouterA that includes the user name of RouterB.
The debug condition interfaceinterface command limits debug messaging output to only enabled debugging that applies to the specified interface. For example, if you were to issue the debug condition interface serial 0/0 command followed by the debug ppp authentication command in this scenario, the debug output would consist of PPP authentication messages, but only if those messages also apply to the router’s Serial 0/0 interface.
Configuring a series of debug condition interface interface commands limits debug message output to the series of specified interfaces. The debug output need match only one of the interface conditions to be displayed. For example, you could issue the following commands on RouterA to ensure that PPP authentication debug messages that apply to either the Serial 0/0 interface or the Serial 0/1 interface are displayed on the router:
After issuing the commands above, you could further limit the PPP authentication debug output by issuing the no debug condition interface interface command. For example, issuing the no debug condition interface serial 0/0 command would remove the Serial 0/0 interface condition from the debugging output, which means that only PPP authentication messages that apply to the Serial 0/1 interface would be displayed. You can remove all interface conditions from debugging output by issuing the no debug condition interface all command. After that command is issued, all PPP authentication debugging messages would be displayed unless you also issued the no debug ppp authenticationcommand or the no debug all command.
The debug condition {username username | called dialstring | callerdialstring} command enables you to limit the output of debugging messages by user name, calling party number, or called party number. Applying only one of those conditions to debugging output stops the output of debug messages on all interfaces. The router will then monitor each interface for a condition match. If a match occurs, debug messages will be displayed for that match. In this scenario, the debug condition username RouterB command will display output when an interface sends or receives a PPP authentication packet that contains the user name RouterB. However, because you have also issued the debug condition interface serial 0/0 command and the debug condition interface serial 0/1 command, PPP authentication messages that apply to either of those interfaces will be displayed even if the RouterB user name is not matched.
Reference:
Cisco: Cisco IOS Debug Command Reference, Release 12.2: Enabling Conditional Debugging Commands
Question 4
You issue the ping 192.168.1.1 size 1501 dfbit command on a Cisco device. You notice a message indicating that the DF bit has been set. However, the ping fails.
You want to determine the largest datagram that the connection supports without fragmentation.
Which of the following should you do next? (Select the best answer.)
- Issue the command without the dfbit parameter.
- Issue the command without the size parameter.
- Issue the command with a lower size parameter value.
- Issue the command without the size parameter and without the dfbit parameter.
Correct answer: C
Explanation:
You should issue the command with a lower size parameter value to determine the largest datagram that the connection supports without fragmentation. The IP version 4 (IPv4) donotfragment bit, or DF bit, should be enabled if you want to determine the maximum transmission unit (MTU) size that a given connection supports. By default, packet fragmentation is used to enable oversized packets to traverse the network in chunks that are smaller than the configured MTU. The DF bit configures the ping command to attempt to send packets of a given size without fragmentation. By repeatedly pinging a destination device with smaller and smaller datagram sizes, you can determine the MTU. The ping command supports the ability to modify the size of the datagram that it transmits as well as the ability to enable the DF bit, which is disabled by default. You can configure extended ping features either by issuing the ping command without parameters, which causes the ping command to display a series of configuration prompts, or by specifying parameters on the command line along with the ping command. For example, the ping 192.168.1.1 size 1500 dfbit command configures an extended ping with a destination IP address of 192.168.1.1, a datagram size of 1,500 bytes, and an enabled DF bit. On a connection with an MTU of 1,500 bytes, this ping succeeds, as shown in the following output: Based on the output, you can determine that the ping succeeded. You can also determine that the DF bit is,indeed, enabled. However, issuing the ping 192.168.1.1 size 1501 dfbit command on the same device results in a failure, as shown in the following output: In the output above, issuing the ping 192.168.1.1 size 1501 dfbit command results in a ping failure because the MTU is configured to 1,500 bytes and the DF bit is set. If you were to issue the same command without the dfbit parameter, the ping would succeed because the ping command is allowing the datagram to be fragmented, as shown in the following output: You should not issue the command without the dfbit option, because this disables the DF bit and enables datagram fragmentation. Ping attempts with fragmentation enabled will succeed even if the size parameter remains larger than the configured MTU. You should not issue the command without the size parameter. The size parameter in addition to the presence of the DF bit is what enables you to test which datagrams are larger than the MTU. Without the size parameter, the ping datagram will use its small default size of 100 bytes. Reference:Cisco: Using the Extended ping and Extended traceroute Commands: The Extended ping Command You should issue the command with a lower size parameter value to determine the largest datagram that the connection supports without fragmentation. The IP version 4 (IPv4) donotfragment bit, or DF bit, should be enabled if you want to determine the maximum transmission unit (MTU) size that a given connection supports. By default, packet fragmentation is used to enable oversized packets to traverse the network in chunks that are smaller than the configured MTU. The DF bit configures the ping command to attempt to send packets of a given size without fragmentation. By repeatedly pinging a destination device with smaller and smaller datagram sizes, you can determine the MTU.
The ping command supports the ability to modify the size of the datagram that it transmits as well as the ability to enable the DF bit, which is disabled by default. You can configure extended ping features either by issuing the ping command without parameters, which causes the ping command to display a series of configuration prompts, or by specifying parameters on the command line along with the ping command. For example, the ping 192.168.1.1 size 1500 dfbit command configures an extended ping with a destination IP address of 192.168.1.1, a datagram size of 1,500 bytes, and an enabled DF bit. On a connection with an MTU of 1,500 bytes, this ping succeeds, as shown in the following output:
Based on the output, you can determine that the ping succeeded. You can also determine that the DF bit is,indeed, enabled.
However, issuing the ping 192.168.1.1 size 1501 dfbit command on the same device results in a failure, as shown in the following output:
In the output above, issuing the ping 192.168.1.1 size 1501 dfbit command results in a ping failure because the MTU is configured to 1,500 bytes and the DF bit is set. If you were to issue the same command without the dfbit parameter, the ping would succeed because the ping command is allowing the datagram to be fragmented, as shown in the following output:
You should not issue the command without the dfbit option, because this disables the DF bit and enables datagram fragmentation. Ping attempts with fragmentation enabled will succeed even if the size parameter remains larger than the configured MTU.
You should not issue the command without the size parameter. The size parameter in addition to the presence of the DF bit is what enables you to test which datagrams are larger than the MTU. Without the size parameter, the ping datagram will use its small default size of 100 bytes.
Reference:
Cisco: Using the Extended ping and Extended traceroute Commands: The Extended ping Command
Question 5
RouterA’s Serial 0/0 interface is connected to RouterB. RouterA’s Serial 0/1 interface is connected to RouterC.
You issue the debug ppp authentication on RouterA and then transition all connected interfaces to the up state.
Next, you issue the show debug condition command on RouterA and receive the following output:
Using the least amount of administrative effort, which of the following should you issue to receive PPP authentication debug output from both RouterB and RouterC? (Select the best answer.)
- no debug alldebug condition interface serial 0/0 -0/1 debug condition username JohnnyB debug ppp authentication
- debug condition interface serial 0/1
- no debug alldebug condition interface serial 0/0 debug condition interface serial 0/1 debug condition username JohnnyB debug ppp authentication
- no debug condition interface all
Correct answer: B
Explanation:
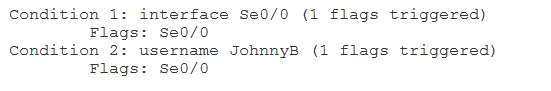
You should issue the debug condition interface serial 0/1 command on RouterA to receive PointtoPoint (PPP) authentication debug output from both RouterB and RouterC by using the least amount of administrative effort. The debug condition interface interface command limits debug messaging output to only enabled debugging that applies to the specified interface. Issuing the debug condition interface serial 0/0command and the debug condition username JohnnyB command followed by the debug ppp authentication command in this scenario causes the debug output to consist of PPP authentication messages, but only if those messages also apply to the router’s Serial 0/0 interface or include the user name of JohnnyB. Based on the output of the show debug condition command in this scenario, you can determine that PPP authentication output is only displayed if it occurs on the Serial 0/0 interface, which is connected to RouterB, or if it includes a user name of JohnnyB. In addition, you can determine that both the Serial 0/0 interface and the user name JohnnyB have already triggered flags a single time each. Therefore, it is likely that PPP authentication has occurred on the Serial 0/0 interface and included the user name JohnnyB. The debug condition interface command accepts only one interface per line. However, it is not necessary to configure all interface conditions in a sequential fashion before enabling debugging. Therefore, issuing only the debug condition interface serial 0/1command will produce the results you require in this scenario by using the least amount of administrative effort. Configuring a series of debug condition interface interface commands limits debug message output to the series of specified interfaces. The debug output need match only one of the interface conditions to be displayed. For example, you could issue the following commands on RouterA to ensure that PPP authentication debug messages that apply to either the Serial 0/0 interface or the Serial 0/1 interface are displayed on the router:RouterA#debug condition interface serial 0/0 RouterA#debug condition interface serial 0/1 RouterA#debug ppp authentication After issuing the commands above, you could further limit the PPP authentication debug output by issuing the no debug condition interface interface command. For example, issuing the no debug condition interface serial 0/0 command would remove the Serial 0/0 interface condition from the debugging output, which means that only PPP authentication messages that apply to the Serial 0/1 interface would be displayed. The debug condition {username username | called dialstring | callerdialstring} command enables you to limit the output of debugging messages by user name, calling party number, or called party number. Applying only one of those conditions to debugging output stops the output of debug messages on all interfaces. The router will then monitor each interface for a condition match. If a match occurs, debug messages will be displayed for that match. In this scenario, the debug condition username RouterB command will display output when an interface sends or receives a PPP authentication packet that contains the user name RouterB. However, because you have also issued the debug condition interface serial 0/0 command and the debug condition interface serial 0/1 command, PPP authentication messages that apply to either of those interfaces will be displayed even if the RouterB user name is not matched. It is not necessary to issue the no debug condition interface all command in this scenario, because this command would remove all existing interface conditions. After that command is issued, all PPP authentication debugging messages would be displayed unless you also issued the no debug ppp authentication command or the no debug allcommand. This would require you to reissue the debug condition interface serial 0/0command in addition to issuing the debug condition interface serial 0/1 command, which increases administrative effort. There is no need to issue the no debug all command in this scenario, because you can add debug conditions to an existing debugging process. Issuing the no debug allcommand would disable the debugging process that is already running. You do not need to issue the debug condition interface serial 0/0 command or the debug condition username JohnnyB command in this scenario. Both of these commands have already been issued, as you can determine by the output of the show debug condition command. Reissuing these command would cause the router to produce the % Condition already set message. Issuing the debug condition interface serial 0/0 -0/1 would not meet the requirements in this scenario. This command contains invalid syntax. Reference:Cisco: Cisco IOS Debug Command Reference, Release 12.2: Enabling Conditional Debugging Commands You should issue the debug condition interface serial 0/1 command on RouterA to receive PointtoPoint (PPP) authentication debug output from both RouterB and RouterC by using the least amount of administrative effort. The debug condition interface interface command limits debug messaging output to only enabled debugging that applies to the specified interface. Issuing the debug condition interface serial 0/0command and the debug condition username JohnnyB command followed by the debug ppp authentication command in this scenario causes the debug output to consist of PPP authentication messages, but only if those messages also apply to the router’s Serial 0/0 interface or include the user name of JohnnyB.
Based on the output of the show debug condition command in this scenario, you can determine that PPP authentication output is only displayed if it occurs on the Serial 0/0 interface, which is connected to RouterB, or if it includes a user name of JohnnyB. In addition, you can determine that both the Serial 0/0 interface and the user name JohnnyB have already triggered flags a single time each. Therefore, it is likely that PPP authentication has occurred on the Serial 0/0 interface and included the user name JohnnyB.
The debug condition interface command accepts only one interface per line. However, it is not necessary to configure all interface conditions in a sequential fashion before enabling debugging. Therefore, issuing only the debug condition interface serial 0/1command will produce the results you require in this scenario by using the least amount of administrative effort.
Configuring a series of debug condition interface interface commands limits debug message output to the series of specified interfaces. The debug output need match only one of the interface conditions to be displayed. For example, you could issue the following commands on RouterA to ensure that PPP authentication debug messages that apply to either the Serial 0/0 interface or the Serial 0/1 interface are displayed on the router:
RouterA#debug condition interface serial 0/0
RouterA#debug condition interface serial 0/1
RouterA#debug ppp authentication
After issuing the commands above, you could further limit the PPP authentication debug output by issuing the no debug condition interface interface command. For example, issuing the no debug condition interface serial 0/0 command would remove the Serial 0/0 interface condition from the debugging output, which means that only PPP authentication messages that apply to the Serial 0/1 interface would be displayed.
The debug condition {username username | called dialstring | callerdialstring} command enables you to limit the output of debugging messages by user name, calling party number, or called party number. Applying only one of those conditions to debugging output stops the output of debug messages on all interfaces. The router will then monitor each interface for a condition match. If a match occurs, debug messages will be displayed for that match. In this scenario, the debug condition username RouterB command will display output when an interface sends or receives a PPP authentication packet that contains the user name RouterB. However, because you have also issued the debug condition interface serial 0/0 command and the debug condition interface serial 0/1 command, PPP authentication messages that apply to either of those interfaces will be displayed even if the RouterB user name is not matched.
It is not necessary to issue the no debug condition interface all command in this scenario, because this command would remove all existing interface conditions. After that command is issued, all PPP authentication debugging messages would be displayed unless you also issued the no debug ppp authentication command or the no debug allcommand. This would require you to reissue the debug condition interface serial 0/0command in addition to issuing the debug condition interface serial 0/1 command, which increases administrative effort.
There is no need to issue the no debug all command in this scenario, because you can add debug conditions to an existing debugging process. Issuing the no debug allcommand would disable the debugging process that is already running.
You do not need to issue the debug condition interface serial 0/0 command or the debug condition username JohnnyB command in this scenario. Both of these commands have already been issued, as you can determine by the output of the show debug condition command. Reissuing these command would cause the router to produce the % Condition already set message.
Issuing the debug condition interface serial 0/0 -0/1 would not meet the requirements in this scenario. This command contains invalid syntax.
Reference:
Cisco: Cisco IOS Debug Command Reference, Release 12.2: Enabling Conditional Debugging Commands
Question 6
You issue the ping 192.168.1.1 size 1600 command on a Cisco device that is configured with the default system MTU. All pings succeed.
Which of the following is most likely true? (Select the best answer.)
- The interface is configured with an MTU of at least 1,600.
- The pings were sent to the destination in a fragmented fashion.
- The DF bit has been enabled, causing the pings to succeed.
- The datagram size specified is below the default MTU value.
Correct answer: B
Explanation:
Most likely, the pings were sent to the destination in a fragmented fashion because the IP version 4 (IPv4) donotfragment bit, or DF bit, has not been set in this scenario. By default, packet fragmentation is used to enable oversized packets to traverse the network in chunks that are smaller than the configured maximum transmission unit (MTU.) Enabling the DF bit configures the ping command to attempt to send packets of a given size without fragmentation. By repeatedly pinging a destination device with smaller and smaller datagram sizes, you can determine the MTU. The ping command supports the ability to modify the size of the datagram that it transmits as well as the ability to enable the DF bit, which is disabled by default. You can configure extended ping features either by issuing the ping command without parameters, which causes the ping command to display a series of configuration prompts, or by specifying parameters on the command line along with the ping command. For example, the ping 192.168.1.1 size 1500 dfbit command configures an extended ping with a destination IP address of 192.168.1.1, a datagram size of 1,500 bytes, and an enabled DF bit. On a connection with an MTU of 1,500 bytes, this ping succeeds, as shown in the following output: Based on the output, you can determine that the ping succeeded. You can also determine that the DF bit is,indeed, enabled. However, issuing the ping 192.168.1.1 size 1501 dfbit command on the same device results in a failure, as shown in the following output: In the output above, issuing the ping 192.168.1.1 size 1501 dfbit command results in a ping failure because the MTU is configured to 1,500 bytes and the DF bit is set. If you were to issue the same command without the dfbit parameter, the ping would succeed because the ping command is allowing the datagram to be fragmented, as shown in the following output: The interface is not configured with an MTU value of at least 1,600 in this scenario. In addition, the datagram size specified is not below the default MTU value on a Cisco device. By default, a Cisco device has a system MTU of 1,500 bytes. In this scenario, you have issued the ping 192.168.1.1 size 1600 command on a device that is configured with the system default MTU. The DF bit has not been enabled in this scenario. In order to enable the DF bit, you should issue the ping command with the dfbit parameter. Reference:Cisco: Using the Extended ping and Extended traceroute Commands: The Extended ping Command Most likely, the pings were sent to the destination in a fragmented fashion because the IP version 4 (IPv4) donotfragment bit, or DF bit, has not been set in this scenario. By default, packet fragmentation is used to enable oversized packets to traverse the network in chunks that are smaller than the configured maximum transmission unit (MTU.) Enabling the DF bit configures the ping command to attempt to send packets of a given size without fragmentation. By repeatedly pinging a destination device with smaller and smaller datagram sizes, you can determine the MTU.
The ping command supports the ability to modify the size of the datagram that it transmits as well as the ability to enable the DF bit, which is disabled by default. You can configure extended ping features either by issuing the ping command without parameters, which causes the ping command to display a series of configuration prompts, or by specifying parameters on the command line along with the ping command. For example, the ping 192.168.1.1 size 1500 dfbit command configures an extended ping with a destination IP address of 192.168.1.1, a datagram size of 1,500 bytes, and an enabled DF bit. On a connection with an MTU of 1,500 bytes, this ping succeeds, as shown in the following output:
Based on the output, you can determine that the ping succeeded. You can also determine that the DF bit is,indeed, enabled. However, issuing the ping 192.168.1.1 size 1501 dfbit command on the same device results in a failure, as shown in the following output:
In the output above, issuing the ping 192.168.1.1 size 1501 dfbit command results in a ping failure because the MTU is configured to 1,500 bytes and the DF bit is set. If you were to issue the same command without the dfbit parameter, the ping would succeed because the ping command is allowing the datagram to be fragmented, as shown in the following output:
The interface is not configured with an MTU value of at least 1,600 in this scenario. In addition, the datagram size specified is not below the default MTU value on a Cisco device. By default, a Cisco device has a system MTU of 1,500 bytes. In this scenario, you have issued the ping 192.168.1.1 size 1600 command on a device that is configured with the system default MTU.
The DF bit has not been enabled in this scenario. In order to enable the DF bit, you should issue the ping command with the dfbit parameter.
Reference:
Cisco: Using the Extended ping and Extended traceroute Commands: The Extended ping Command
Question 7
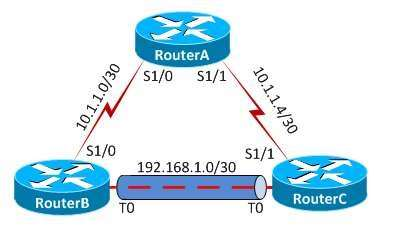
You administer the network in the following exhibit:
All routers are configured to the system MTU defaults.
You issue the ping 192.168.1.2 size 1500 dfbit command from RouterB, but the ping fails.
Which of the following is most likely the cause of the failure? (Select the best answer.)
- The GRE tunnel MTU is 1,476.
- The system default MTU is 1,400.
- The DF bit is not enabled.
- The GRE tunnel does not support fragmented datagrams.
Correct answer: A
Explanation:
Most likely, the Generic Routing Encapsulation (GRE) tunnel maximum transmission unit (MTU) is 1,476 if the ping fails in this scenario. By default, Cisco routers are configured with a system MTU of 1,500 bytes, which includes a 20byte IP header and 1,480 bytes of payload. The ping 192.168.1.2 size 1500 dfbit command in this scenario attempts to send a datagram of 1,500 bytes to a destination address of 192.168.1.2 without fragmenting the datagram into smaller pieces. In this scenario, the donotfragment, or DF bit, has been enabled with the pingcommand. When the DF bit is set, the device attempts to send packets without fragmentation. If the packet is larger than the MTU, the attempt will fail. Because the GRE tunnel’s MTU supports a maximum of 1,476 bytes, a ping with a size of 1,500 bytes that does not permit fragmentation will fail. GRE tunnels add a 24byte header to an IP packet. However, a default GRE tunnel MTU is 24 bytes smaller than the MTU of the physical interface. When the DF bit is not set, an unencapsulated 1,500byte packet would be split into two unencapsulated packets: a 1,476byte packet and a 44byte packet, prior to being transported across the tunnel. This process enables each fragment of the packet to include the 24byte GRE header when it traverses the physical interface that is being used as the tunnel’s source. The total sizes of the packet fragments that traverse the physical interface thus become 1,500 bytes and 68 bytes, respectively. The DF bit is enabled in this scenario. The ping command supports the ability to modify the size of the datagram it transmits as well as the ability to enable the DF bit, which is disabled by default. You can configure extended ping features either by issuing the pingcommand without parameters, which causes the ping command to display a series of configuration prompts, or by specifying parameters on the command line along with the ping command. For example, the ping 192.168.1.1 size 1500 dfbit command configures an extended ping with a destination IP address of 192.168.1.1, a datagram size of 1,500 bytes, and an enabled DF bit. The system default MTU on Cisco devices is 1,500, not 1,400. Therefore, a system default MTU of 1,400 is not causing the failure in this scenario. In addition, GRE tunnels do support fragmented datagrams. Reference:Cisco: Resolve IP Fragmentation, MTU, MSS, and PMTUD Issues with GRE and IPSEC: Scenario 5 Most likely, the Generic Routing Encapsulation (GRE) tunnel maximum transmission unit (MTU) is 1,476 if the ping fails in this scenario. By default, Cisco routers are configured with a system MTU of 1,500 bytes, which includes a 20byte IP header and 1,480 bytes of payload. The ping 192.168.1.2 size 1500 dfbit command in this scenario attempts to send a datagram of 1,500 bytes to a destination address of 192.168.1.2 without fragmenting the datagram into smaller pieces.
In this scenario, the donotfragment, or DF bit, has been enabled with the pingcommand. When the DF bit is set, the device attempts to send packets without fragmentation. If the packet is larger than the MTU, the attempt will fail. Because the GRE tunnel’s MTU supports a maximum of 1,476 bytes, a ping with a size of 1,500 bytes that does not permit fragmentation will fail.
GRE tunnels add a 24byte header to an IP packet. However, a default GRE tunnel MTU is 24 bytes smaller than the MTU of the physical interface. When the DF bit is not set, an unencapsulated 1,500byte packet would be split into two unencapsulated packets: a 1,476byte packet and a 44byte packet, prior to being transported across the tunnel. This process enables each fragment of the packet to include the 24byte GRE header when it traverses the physical interface that is being used as the tunnel’s source. The total sizes of the packet fragments that traverse the physical interface thus become 1,500 bytes and 68 bytes, respectively.
The DF bit is enabled in this scenario. The ping command supports the ability to modify the size of the datagram it transmits as well as the ability to enable the DF bit, which is disabled by default. You can configure extended ping features either by issuing the pingcommand without parameters, which causes the ping command to display a series of configuration prompts, or by specifying parameters on the command line along with the ping command. For example, the ping 192.168.1.1 size 1500 dfbit command configures an extended ping with a destination IP address of 192.168.1.1, a datagram size of 1,500 bytes, and an enabled DF bit.
The system default MTU on Cisco devices is 1,500, not 1,400. Therefore, a system default MTU of 1,400 is not causing the failure in this scenario. In addition, GRE tunnels do support fragmented datagrams.
Reference:
Cisco: Resolve IP Fragmentation, MTU, MSS, and PMTUD Issues with GRE and IPSEC: Scenario 5
Question 8
Which of the following statements is true regarding OSPF connections over a virtual link? (Select the best answer.)
- Traffic is encapsulated and decapsulated by tunnel endpoints.
- Packets contain additional overhead because of tunnel headers.
- The transit area can be a stub area.
- Only routing updates are tunneled.
Correct answer: D
Explanation:
Only routing updates are tunneled when an Open Shortest Path First (OSPF) connection is formed over a virtual link. All other traffic is sent natively over the physical links. An OSPF virtual link is useful for the following situations:Connecting a remote area to the backbone area through a standard area Connecting discontiguous backbone areas All areas in an OSPF internetwork must be directly connected to the backbone area, Area 0. When a direct connection to the backbone area is not possible, a virtual link must be created between two area border routers (ABRs) to connect the remote area to the backbone area through a transit area. The following restrictions apply to virtual links:The routers at each end of the virtual link must share a common area. The transit area cannot be a stub area. One of the routers at either end of the virtual link must connect to the backbone area. Area 0 must be contiguous. The loss of a router or the loss of a link between two routers can cause Area 0 to become discontiguous, or partitioned. A virtual link can be created to connect the discontiguous sections of the Area 0 backbone across a transit area. To connect a discontiguous backbone, the routers at each end of the virtual link must connect to the backbone area and the transit area. It is important to note that adjacencies formed over virtual links are not visible in the output of the show ip ospf neighbors command. In order to verify that an OSPF adjacency has formed over a virtual link, you can examine the output of the show ip ospf virtuallinks command. Generic Routing Encapsulation (GRE) tunnels can be used instead of virtual links to form OSPF connections between discontiguous backbone areas or to connect a remote area to the backbone area through a standard area. Unlike virtual links, a GRE tunnel encapsulates and decapsulates all traffic at the tunnel endpoints, including the routing updates. GRE tunnels can also transit a stub area. However, GRE tunnels create additional headers, adding overhead to the traffic. It is important to note that an adjacency can only remain stable over a GRE tunnel if the destination remains reachable through the tunnel. If the OSPF neighbor is not reachable through the tunnel, OSPF will drop the adjacency. Reference:Cisco: OSPF Virtual Link: Using a GRE Tunnel Instead of a Virtual Link Only routing updates are tunneled when an Open Shortest Path First (OSPF) connection is formed over a virtual link. All other traffic is sent natively over the physical links. An OSPF virtual link is useful for the following situations:
- Connecting a remote area to the backbone area through a standard area
- Connecting discontiguous backbone areas
All areas in an OSPF internetwork must be directly connected to the backbone area, Area 0. When a direct connection to the backbone area is not possible, a virtual link must be created between two area border routers (ABRs) to connect the remote area to the backbone area through a transit area. The following restrictions apply to virtual links:
- The routers at each end of the virtual link must share a common area.
- The transit area cannot be a stub area.
- One of the routers at either end of the virtual link must connect to the backbone area.
Area 0 must be contiguous. The loss of a router or the loss of a link between two routers can cause Area 0 to become discontiguous, or partitioned. A virtual link can be created to connect the discontiguous sections of the Area 0 backbone across a transit area. To connect a discontiguous backbone, the routers at each end of the virtual link must connect to the backbone area and the transit area.
It is important to note that adjacencies formed over virtual links are not visible in the output of the show ip ospf neighbors command. In order to verify that an OSPF adjacency has formed over a virtual link, you can examine the output of the show ip ospf virtuallinks command.
Generic Routing Encapsulation (GRE) tunnels can be used instead of virtual links to form OSPF connections between discontiguous backbone areas or to connect a remote area to the backbone area through a standard area. Unlike virtual links, a GRE tunnel encapsulates and decapsulates all traffic at the tunnel endpoints, including the routing updates. GRE tunnels can also transit a stub area. However, GRE tunnels create additional headers, adding overhead to the traffic.
It is important to note that an adjacency can only remain stable over a GRE tunnel if the destination remains reachable through the tunnel. If the OSPF neighbor is not reachable through the tunnel, OSPF will drop the adjacency.
Reference:
Cisco: OSPF Virtual Link: Using a GRE Tunnel Instead of a Virtual Link
Question 9
Which of the following is not a GRE tunnel state on a Cisco device? (Select the best answer.)
- Administratively down/down
- Down/up
- Reset/down
- Up/down
- Up/up
Correct answer: B
Explanation:
Down/up is not a Generic Routing Encapsulation (GRE) tunnel state on a Cisco device. Nor is Down/up a valid state for any other connection on a Cisco device, because a line protocol cannot be in the up state when an interface is in the Down or Administratively down state. Interface states and line protocol states are often presented as a single connection state separated by a slash. The state preceding the slash represents the interface state. The state succeeding the slash represents the line protocol state. In order for the line protocol state to be up, the interface state must also be up. A GRE tunnel can exist in one of the following four states:Administratively down/down Reset/down Up/down Up/up A tunnel in the Administratively down/down state has been configured with the shutdown command. By default, a tunnel interface automatically transitions to the upstate when it is created. Therefore, it is not normally necessary to issue the no shutdowncommand to bring a tunnel interface up unless you have previously issued the shutdowncommand. A tunnel in the Reset/down state is typically transiting through that state because a software interface reset has occurred. Software resets can happen if the tunnel is misconfigured. For example, a software reset might occur if a tunnel interface has been configured to use its own IP address as a next hop. A tunnel in the Up/down state indicates that the tunnel interface is configured but something is interfering with the line protocol. This state commonly occurs when the tunnel interface is configured to use an incorrect destination address or when the physical interface has no route to the tunnel’s destination address. It can also occur if the tunnel destination address lies through the tunnel itself. A tunnel in the Up/up state indicates that both the tunnel interface and the line protocol are up and functional. If something is preventing communication between endpoints on opposite ends of the tunnel and the tunnel is in the Up/up state on each end, you should continue troubleshooting beyond the tunnel configuration. Reference:Cisco: GRE Tunnel Interface States and What Impacts Them: Four Different Tunnel States Down/up is not a Generic Routing Encapsulation (GRE) tunnel state on a Cisco device. Nor is Down/up a valid state for any other connection on a Cisco device, because a line protocol cannot be in the up state when an interface is in the Down or Administratively down state. Interface states and line protocol states are often presented as a single connection state separated by a slash. The state preceding the slash represents the interface state. The state succeeding the slash represents the line protocol state. In order for the line protocol state to be up, the interface state must also be up.
A GRE tunnel can exist in one of the following four states:
- Administratively down/down
- Reset/down
- Up/down
- Up/up
A tunnel in the Administratively down/down state has been configured with the shutdown command. By default, a tunnel interface automatically transitions to the upstate when it is created. Therefore, it is not normally necessary to issue the no shutdowncommand to bring a tunnel interface up unless you have previously issued the shutdowncommand.
A tunnel in the Reset/down state is typically transiting through that state because a software interface reset has occurred. Software resets can happen if the tunnel is misconfigured. For example, a software reset might occur if a tunnel interface has been configured to use its own IP address as a next hop.
A tunnel in the Up/down state indicates that the tunnel interface is configured but something is interfering with the line protocol. This state commonly occurs when the tunnel interface is configured to use an incorrect destination address or when the physical interface has no route to the tunnel’s destination address. It can also occur if the tunnel destination address lies through the tunnel itself.
A tunnel in the Up/up state indicates that both the tunnel interface and the line protocol are up and functional. If something is preventing communication between endpoints on opposite ends of the tunnel and the tunnel is in the Up/up state on each end, you should continue troubleshooting beyond the tunnel configuration.
Reference:
Cisco: GRE Tunnel Interface States and What Impacts Them: Four Different Tunnel States
Question 10
Which of the following statements is true regarding OSPF connections over a GRE tunnel? (Select the best answer.)
- Traffic is encapsulated and decapsulated by tunnel endpoints.
- Tunnel headers do not create any additional overhead.
- The transit area cannot be a stub area.
- Only routing updates are tunneled.
Correct answer: A
Explanation:
Traffic is encapsulated and decapsulated by tunnel endpoints when Open Shortest Path First (OSPF) connections are formed over a Generic Routing Encapsulation (GRE) tunnel. All areas in an OSPF internetwork must be directly connected to the backbone area, Area 0. When a direct connection to the backbone area is not possible, a GRE tunnel or a virtual link can be created between two area border routers (ABRs) to connect the remote area to the backbone area through a transit area. However, there are some important differences between the two methods. Unlike virtual links, a GRE tunnel encapsulates and decapsulates all traffic at the tunnel endpoints, including the routing updates. GRE tunnels can also transit a stub area. However, GRE tunnels create additional headers, adding overhead to the traffic. It is important to note that an adjacency can only remain stable over a GRE tunnel if the destination remains reachable through the tunnel. If the OSPF neighbor is not reachable through the tunnel, OSPF will drop the adjacency. Only routing updates are tunneled when an OSPF connection is formed over a virtual link. All other traffic is sent natively over the physical links. The following restrictions apply to virtual links:The routers at each end of the virtual link must share a common area. The transit area cannot be a stub area. One of the routers at either end of the virtual link must connect to the backbone area. It is important to note that adjacencies formed over virtual links are not visible in the output of the show ip ospf neighbors command. In order to verify that an OSPF adjacency has formed over a virtual link, you can examine the output of the show ip ospf virtuallinks command. Reference:Cisco: OSPF Virtual Link: Using a GRE Tunnel Instead of a Virtual Link Traffic is encapsulated and decapsulated by tunnel endpoints when Open Shortest Path First (OSPF) connections are formed over a Generic Routing Encapsulation (GRE) tunnel. All areas in an OSPF internetwork must be directly connected to the backbone area, Area 0. When a direct connection to the backbone area is not possible, a GRE tunnel or a virtual link can be created between two area border routers (ABRs) to connect the remote area to the backbone area through a transit area.
However, there are some important differences between the two methods. Unlike virtual links, a GRE tunnel encapsulates and decapsulates all traffic at the tunnel endpoints, including the routing updates. GRE tunnels can also transit a stub area. However, GRE tunnels create additional headers, adding overhead to the traffic. It is important to note that an adjacency can only remain stable over a GRE tunnel if the destination remains reachable through the tunnel. If the OSPF neighbor is not reachable through the tunnel, OSPF will drop the adjacency.
Only routing updates are tunneled when an OSPF connection is formed over a virtual link. All other traffic is sent natively over the physical links.
The following restrictions apply to virtual links:
- The routers at each end of the virtual link must share a common area.
- The transit area cannot be a stub area.
- One of the routers at either end of the virtual link must connect to the backbone area.
It is important to note that adjacencies formed over virtual links are not visible in the output of the show ip ospf neighbors command. In order to verify that an OSPF adjacency has formed over a virtual link, you can examine the output of the show ip ospf virtuallinks command.
Reference:
Cisco: OSPF Virtual Link: Using a GRE Tunnel Instead of a Virtual Link

