File Info
| Exam | IBM Certified Business Process Analyst |
| Number | C9550-606 |
| File Name | IBM.C9550-606.Pass4Sure.2018-09-13.60q.vcex |
| Size | 493 KB |
| Posted | Sep 13, 2018 |
| Download | IBM.C9550-606.Pass4Sure.2018-09-13.60q.vcex |
How to open VCEX & EXAM Files?
Files with VCEX & EXAM extensions can be opened by ProfExam Simulator.
Coupon: MASTEREXAM
With discount: 20%


Demo Questions
Question 1
A company's new approach to selling requires extensive resource planning. A team of process analysts has been assembled to perform this work. Which option is
sufficient to enforce consistent simulations behavior across the team? All analysts:
- set the same random number seed and process availability start and end dates in the simulation profiles.
- set the same random number seed, process availability start and end dates, and maximum simulation duration in the simulation profiles.
- set unique random number seed, process availability start and end dates, maximum simulation duration and maximum number of process invocations in the simulation profiles.
- set unique random number seeds and process availability start and end dates in the simulation profiles.
Correct answer: A
Question 2
When reviewing the simulations results, the process analyst discovered that for each task in the process that has multiple output criteria, the simulation engine would make a random selection of an output path, and generate outgoing tokens for each output defined in the output criterion. Which of the following settings was used during the simulation?
- Randomly to a single path.
- Based on an expression.
- Based on probabilities to a single path.
- Based on probabilities to multiple paths.
Correct answer: C
Explanation:
Question 3
During an exception period, a resource could not complete a task before the end of the task's processing time. What should be done to ensure that the resource remains allocated until the task is completed?
- Check "Use resources time required as a task processing time".
- Check the preference "Run simulation without resource requirements".
- Increase the "Task duration" to match the resource required time.
- Set the task's "Resource wait time" to be the resource shortage time.
Correct answer: A
Question 4
A process analyst has performed simulation upon a business process and is analyzing resource allocation within the process. The average elapsed duration for the process is 2 hours, 57 minutes. After running the Process Resource Dynamic Analysis Report, it is observed that the Field Tech Resource has an average Quantity Allocated value of .6 units. The Process Resource Allocation Dynamic Analysis Report is also generated against the simulation results, and it is determined that there is an Average Shortage Duration of 37 minutes, 30 seconds for the resource. The process analyst also observes that the Field Tech Resource has been defined to the process as a bulk resource with an availability value of 3. Based on this information, what conclusions can the process analyst draw?
- There is at least one case in the business process that does not allocate the Field Tech Resource. The pool of available Field Tech Resources can be reduced to 1 to eliminate resources that are never allocated to the process. This will not affect the Average Shortage Duration value.
- There are too many Field Tech Resources available to the process, as the sum of all Field Tech Resource allocations to activities in the process divided by the total number of process instances is less than one. This indicates that some Field Tech Resources are never allocated the business process.
- There is at least one case in the business process that does not allocate the Field Tech Resource, however there are also multiple concurrent process instances that are allocating the resource concurrently and are competing for the resource. The pool of available Field Tech Resources can be increased to reduce the Average Shortage Duration and the Average Quantity Allocated would increase to a value close to 1.0 units.
- There is at least one case in the business process that does not allocate the Field Tech Resource, however there are also multiple concurrent process instances that are allocating the resource concurrently and are competing for the resource. The pool of available Field Tech Resources can be increased to reduce the Average Shortage Duration and the Average Quantity Allocated would remain the same in subsequent simulations.
Correct answer: D
Explanation:
Question 5
A model is going to be simulated to capture results that represent as close to real conditions as possible. What simulation setting should be used to ensure that the results reflect the random nature of the process? The random number seed needs to be set to:
- Zero
- 1
- 2
- N
Correct answer: A
Question 6
Which predefined process report shows the sequence of steps within a process and the relationships of a process to other processes?
- Process Details Report
- Process Procedure Report
- Process Specification Report
- Process Level Details Report
Correct answer: B
Question 7
To display the names of all tasks in a process model in a table format, what must the process analyst do to accurately define the table after adding the table to the report template?
- 1. In the Properties View for the table, populate the Grouped By Field by navigating to and selecting the immediate parent of the data to be displayed.2. Select the appropriate table cell.3. In the Properties View for the table cell, populate the Data Field Name by navigating to and selecting the data element to be displayed.
- 1. In the Properties View for the table, populate the Grouped By Field by navigating to and selecting the immediate parent of the data to be displayed.2. Create a Data Field within the appropriate table cell.3. In the Properties View for the Data Field, populate the Data Field Name by navigating to and selecting the data element to be displayed.
- 1. In the Properties View for the table, populate the Data Field Path by navigating to and selecting the immediate parent of the data to be displayed.2. Select the appropriate table cell.3. In the Properties View for the Data Field, populate the Data Field Path by navigating to and selecting the data element to be displayed.
- 1. In the Properties View for the table, populate the Data Field Path by navigating to and selecting the immediate parent of the data to be displayed.2. Create a Data Field within the appropriate table cell.3. In the Properties View for the Data Field, populate the Data Field Path by navigating to and selecting the data element to be displayed.
Correct answer: B
Question 8
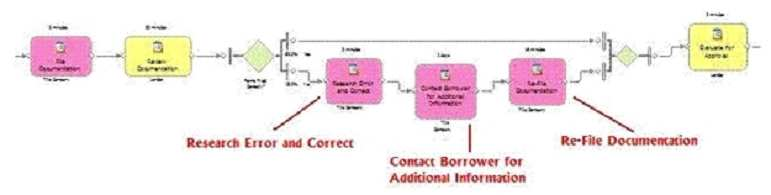
Refer to the Exhibit.
A process analyst has modeled the current state of a mortgage approval process as shown in the Exhibit. Historical process performance measurements have
indicated when there is an error in the filing of the mortgage documentation, the corrective activities increase the process duration by 50% and the process cost by 35%. How can the process analyst prove the current state model reflects this situation?
- Assign an exception classifier to each activity associated with incorrectly filed documentation.Run simulation analysis upon the process and determine its average cost and duration from the simulation control panel. Generate the Classifier Cost and Duration report upon the simulation results.Compare the process' average cost and duration against the Classifier report's values.
- Assign an exception classifier to each activity associated with incorrectly filed documentation Run simulation analysis upon the process and generate the Process Cases Summary report.Determine which cases represent process instances that perform activities associated with incorrectly filed documentation.Compare the average cost and duration of these cases against cases that do not perform these corrective activities.
- Run simulation analysis upon the process and generate the Processes Cost Comparison report to compare the cost of the process between cases that perform corrective activities against those that do not.Repeat this comparison for duration by generating and analyzing the Processes Duration Comparison report.
- Assign an exception classifier to each activity associated with incorrectly filed documentation.Run simulation analysis upon the process and generate the Process Classifier Cost and Duration report.Compare the total average costs and durations of the exception classifier activities against non-exception activities.
Correct answer: B
Question 9
When is it applicable to use a query?
- To extract and view information about the elements of models.
- To extract, view and print information about the elements of models.
- To extract and view information about model elements and simulation results.
- To extract, view, and print information about model elements and simulation results.
Correct answer: A
Question 10
Which of the following is an example of a Key Performance Indicator (KPI)?
- Supplier response time.
- Customer Order processing time.
- Order must be processed within 3 days.
- Working duration of a business process.
Correct answer: C

