File Info
| Exam | Certification in Business Data Analytics |
| Number | CBDA |
| File Name | IIBA.CBDA.VCEplus.2024-12-02.50q.tqb |
| Size | 642 KB |
| Posted | Dec 02, 2024 |
| Download | IIBA.CBDA.VCEplus.2024-12-02.50q.tqb |
How to open VCEX & EXAM Files?
Files with VCEX & EXAM extensions can be opened by ProfExam Simulator.
Coupon: MASTEREXAM
With discount: 20%
Demo Questions
Question 1
An analyst is interested in providing a visual diagram to compare and contrast the characteristics of four different solution options. Each option should be represented by their cost, value, and risk level. What type of chart would accomplish this task?
- Bubble
- Waterfall
- Pie
- Bullet
Correct answer: A
Explanation:
A bubble chart is a type of chart that displays three dimensions of data: the x-axis, the y-axis, and the size of the bubble. A bubble chart can be used to compare and contrast the characteristics of different solution options by plotting their cost, value, and risk level on the three axes. For example, a solution option with a high cost, high value, and low risk would be represented by a large bubble on the upper left corner of the chart, while a solution option with a low cost, low value, and high risk would be represented by a small bubble on the lower right corner of the chart. A bubble chart can help the analyst and the stakeholders to visualize the trade-offs and benefits of each solution option and to select the most optimal one based on the business objectives and constraints.Reference:Guide to Business Data Analytics, page 77;Introduction to Business Data Analytics: A Practitioner View, page 16; [Business Data Analytics: A Practical Guide], page 121. A bubble chart is a type of chart that displays three dimensions of data: the x-axis, the y-axis, and the size of the bubble. A bubble chart can be used to compare and contrast the characteristics of different solution options by plotting their cost, value, and risk level on the three axes. For example, a solution option with a high cost, high value, and low risk would be represented by a large bubble on the upper left corner of the chart, while a solution option with a low cost, low value, and high risk would be represented by a small bubble on the lower right corner of the chart. A bubble chart can help the analyst and the stakeholders to visualize the trade-offs and benefits of each solution option and to select the most optimal one based on the business objectives and constraints.
Reference:Guide to Business Data Analytics, page 77;Introduction to Business Data Analytics: A Practitioner View, page 16; [Business Data Analytics: A Practical Guide], page 121.
Question 2
A movie production company wants to use analytics to decide which customers would choose to watch or not watch a particular movie after seeing a promotional teaser. The business analysis professional suggests they could make that prediction by identifying characteristics of the new movie and determining if the customer has watched other movies with similar characteristics. This is an example of using the following technique:
- Logistic regression
- Ouster analysis
- Integer programming
- Analysis of variance
Correct answer: A
Explanation:
Logistic regression is a technique that can be used to model the probability of a binary outcome, such as choosing to watch or not watch a movie, based on one or more predictor variables, such as the characteristics of the movie and the customer's viewing history. Logistic regression can help the business analysis professional to identify the factors that influence the customer's decision and to estimate the likelihood of each customer's preference. Logistic regression can also be used to test hypotheses and to evaluate the performance of the predictive model.Reference: [Guide to Business Data Analytics], page 55; [Business Data Analytics: A Practical Guide], page 93; [Introduction to Business Data Analytics: A Practitioner View], page 14. Logistic regression is a technique that can be used to model the probability of a binary outcome, such as choosing to watch or not watch a movie, based on one or more predictor variables, such as the characteristics of the movie and the customer's viewing history. Logistic regression can help the business analysis professional to identify the factors that influence the customer's decision and to estimate the likelihood of each customer's preference. Logistic regression can also be used to test hypotheses and to evaluate the performance of the predictive model.
Reference: [Guide to Business Data Analytics], page 55; [Business Data Analytics: A Practical Guide], page 93; [Introduction to Business Data Analytics: A Practitioner View], page 14.
Question 3
An analytics team has completed some initial data analysis but is considering revising their research question based on their analysis findings. The team was concerned the original question was too broad. What outcome would lead the team to have this concern?
- Data once analyzed had significant data quality issues
- Data the team had planned to use was not available
- Difficult to identify the KPIs to measure
- The source data sets could not be merged
Correct answer: C
Explanation:
A research question is a clear and focused question that guides the data analytics process and defines the expected outcome or value of the analysis1. A research question that is too broad may lead to the concern of being difficult to identify the key performance indicators (KPIs) to measure, as KPIs are specific, quantifiable, and relevant metrics that indicate the progress and success of the analysis in relation to the research question23. A broad research question may also result in too much or too little data, unclear or conflicting objectives, or irrelevant or ambiguous results4.Reference: 1: Guide to Business Data Analytics, IIBA, 2020, p. 202: Guide to Business Data Analytics, IIBA, 2020, p. 233: Key Performance Indicators: Developing, Implementing, and Using Winning KPIs, David Parmenter, 2015, p. 34: How to Write a Good Research Question, ThoughtCo, 2021, 1. A research question is a clear and focused question that guides the data analytics process and defines the expected outcome or value of the analysis1. A research question that is too broad may lead to the concern of being difficult to identify the key performance indicators (KPIs) to measure, as KPIs are specific, quantifiable, and relevant metrics that indicate the progress and success of the analysis in relation to the research question23. A broad research question may also result in too much or too little data, unclear or conflicting objectives, or irrelevant or ambiguous results4.
Reference: 1: Guide to Business Data Analytics, IIBA, 2020, p. 202: Guide to Business Data Analytics, IIBA, 2020, p. 233: Key Performance Indicators: Developing, Implementing, and Using Winning KPIs, David Parmenter, 2015, p. 34: How to Write a Good Research Question, ThoughtCo, 2021, 1.
Question 4
While sourcing data, an analyst runs into a situation where different business units are using different names to refer to the same data element. This lack of standardization is resulting in confusion and additional time required to properly prepare data for analysis. Which practice, if implemented would address this situation and mature the organization's business analytics practice?
- Data quality management
- Database operations management
- Data warehousing
- Meta data management
Correct answer: D
Explanation:
Meta data management is the practice that, if implemented, would address the situation and mature the organization's business analytics practice, because it is a technique that involves defining, documenting, and maintaining the information about the data elements, such as their names, definitions, formats, sources, and relationships. Meta data management can help the analyst resolve the inconsistencies and ambiguities in the data element names, and ensure that the data is standardized, consistent, and understandable across different business units. Meta data management can also help the analyst improve the data quality, accessibility, and usability for the analysis.Reference:Business Analysis Certification in Data Analytics, CBDA | IIBA, CBDA Competencies, Domain 2: Source DataGuide to Business Data Analytics - Iiba - Google Books, page 14Business Data Analytics (IIBA-CBDA Exam preparation) | Udemy, Section 2: Source Data, Lecture 8: Meta Data Management Meta data management is the practice that, if implemented, would address the situation and mature the organization's business analytics practice, because it is a technique that involves defining, documenting, and maintaining the information about the data elements, such as their names, definitions, formats, sources, and relationships. Meta data management can help the analyst resolve the inconsistencies and ambiguities in the data element names, and ensure that the data is standardized, consistent, and understandable across different business units. Meta data management can also help the analyst improve the data quality, accessibility, and usability for the analysis.
Reference:
- Business Analysis Certification in Data Analytics, CBDA | IIBA, CBDA Competencies, Domain 2: Source Data
- Guide to Business Data Analytics - Iiba - Google Books, page 14
- Business Data Analytics (IIBA-CBDA Exam preparation) | Udemy, Section 2: Source Data, Lecture 8: Meta Data Management
Question 5
A dataset contains 10 measures of workplace sustainability. The analytics team is in need of producing a single score of sustainability. Which of the following techniques if used would achieve this objective?
- Logistic regression
- Linkage algorithms
- Factor analysis
- K means clustering
Correct answer: C
Explanation:
Factor analysis is the technique that, if used, would achieve the objective of producing a single score of sustainability, because it is a technique that reduces the dimensionality of a data set by identifying the underlying factors or latent variables that explain the variation and correlation among the observed variables. Factor analysis can help the analytics team combine the 10 measures of workplace sustainability into a smaller number of factors, and then derive a composite score of sustainability based on the factor loadings and weights. Factor analysis can also help the analytics team simplify and interpret the data, and identify the key drivers of sustainability.Reference:Business Analysis Certification in Data Analytics, CBDA | IIBA, CBDA Competencies, Domain 3: Analyze DataUnderstanding the Guide to Business Data Analytics, page 17Business Data Analytics (IIBA-CBDA Exam preparation) | Udemy, Section 3: Analyze Data, Lecture 15: Factor Analysis Factor analysis is the technique that, if used, would achieve the objective of producing a single score of sustainability, because it is a technique that reduces the dimensionality of a data set by identifying the underlying factors or latent variables that explain the variation and correlation among the observed variables. Factor analysis can help the analytics team combine the 10 measures of workplace sustainability into a smaller number of factors, and then derive a composite score of sustainability based on the factor loadings and weights. Factor analysis can also help the analytics team simplify and interpret the data, and identify the key drivers of sustainability.
Reference:
- Business Analysis Certification in Data Analytics, CBDA | IIBA, CBDA Competencies, Domain 3: Analyze Data
- Understanding the Guide to Business Data Analytics, page 17
- Business Data Analytics (IIBA-CBDA Exam preparation) | Udemy, Section 3: Analyze Data, Lecture 15: Factor Analysis
Question 6
An analyst is looking at a particular dataset that includes the scores across all 8th grade students, across three schools. The analyst is trying to determine which type of statistics average to use to best represent the results. On looking through the dataset, the analyst has identified a few extreme outliers. As a result, the analyst was led to use the following type of average:
- Median
- Range
- Mean
- Mode
Correct answer: A
Explanation:
The median is the type of statistics average that the analyst should use to best represent the results, because it is a measure of central tendency that divides the data set into two equal halves. The median is the middle value of the data set when it is arranged in ascending or descending order. The median is not affected by extreme outliers, unlike the mean, which is the arithmetic average of the data set. The median can give a more accurate representation of the typical score of the 8th grade students across the three schools. Options B, C, and D are not types of statistics average, but types of statistics measures that describe other aspects of the data set. The range is a measure of dispersion that shows the difference between the highest and the lowest values of the data set. The mean is a measure of central tendency that shows the sum of the values of the data set divided by the number of values. The mode is a measure of central tendency that shows the most frequent value of the data set.Reference:Business Analysis Certification in Data Analytics, CBDA | IIBA, CBDA Competencies, Domain 3: Analyze DataUnderstanding the Guide to Business Data Analytics, page 17Business Data Analytics (IIBA-CBDA Exam preparation) | Udemy, Section 3: Analyze Data, Lecture 13: Descriptive Statistics The median is the type of statistics average that the analyst should use to best represent the results, because it is a measure of central tendency that divides the data set into two equal halves. The median is the middle value of the data set when it is arranged in ascending or descending order. The median is not affected by extreme outliers, unlike the mean, which is the arithmetic average of the data set. The median can give a more accurate representation of the typical score of the 8th grade students across the three schools. Options B, C, and D are not types of statistics average, but types of statistics measures that describe other aspects of the data set. The range is a measure of dispersion that shows the difference between the highest and the lowest values of the data set. The mean is a measure of central tendency that shows the sum of the values of the data set divided by the number of values. The mode is a measure of central tendency that shows the most frequent value of the data set.
Reference:
- Business Analysis Certification in Data Analytics, CBDA | IIBA, CBDA Competencies, Domain 3: Analyze Data
- Understanding the Guide to Business Data Analytics, page 17
- Business Data Analytics (IIBA-CBDA Exam preparation) | Udemy, Section 3: Analyze Data, Lecture 13: Descriptive Statistics
Question 7
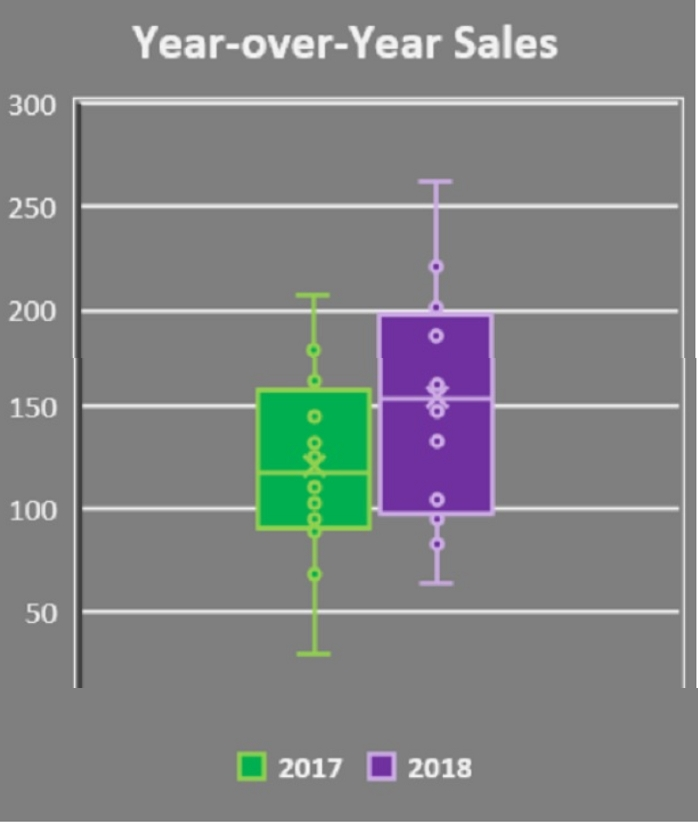
A software company launched a new product in late 2016. The product manager is reviewing a Box and Whisker plot used to compare year-over-year sales, from 2017 to 2018. What is the conclusion he can make from this chart?

- 2017 minimum and maximum sales are higher than 2018, and the 2017 median result is higher than the 2018 median result
- 2017 minimum and maximum sales are higher than 2018, but the 2017 median result is lower than 2018 1st quartile result
- 2018 minimum and maximum sales are higher than 2017, and the 2018 quartile results are higher than 2017 quartile results
- 2018 minimum and maximum sales are higher than 2017, and the 2018 1st quartile is higher than 2017 median result
Correct answer: D
Question 8
The interplay between enterprise systems and data analytics can be envisioned at various layers. The layer that connects the business processes to data analytics is the:
- information layer
- physical layer
- technical layer
- infrastructure layer
Correct answer: A
Explanation:
The information layer is the layer that connects the business processes to data analytics. It consists of the data models, data quality, data governance, and data security that enable the data to be accessed, analyzed, and transformed into insights. The information layer also supports the communication and collaboration among the stakeholders involved in the data analytics process. The other layers are the physical layer, which deals with the hardware and software components of the data infrastructure; the technical layer, which handles the data integration, data storage, data processing, and data analysis techniques; and the infrastructure layer, which provides the network, cloud, and security services for the data environment12Reference: 1: Data and Analytics (D&A) - Gartner 2: Enterprise Data Analytics - SelectHub The information layer is the layer that connects the business processes to data analytics. It consists of the data models, data quality, data governance, and data security that enable the data to be accessed, analyzed, and transformed into insights. The information layer also supports the communication and collaboration among the stakeholders involved in the data analytics process. The other layers are the physical layer, which deals with the hardware and software components of the data infrastructure; the technical layer, which handles the data integration, data storage, data processing, and data analysis techniques; and the infrastructure layer, which provides the network, cloud, and security services for the data environment12
Reference: 1: Data and Analytics (D&A) - Gartner 2: Enterprise Data Analytics - SelectHub
Question 9
The team has completed their analysis on a vast amount of collected data and agree on their recommendations for action.
However, they are having difficulty in developing the appropriate messages to support their recommendations. The business analysis professional suggests which technique to assist the team?
- T-Testing
- Simulation
- Visioning
- Storyboarding
Correct answer: D
Explanation:
Storyboarding is a technique that helps the team to develop the appropriate messages to support their recommendations by creating a visual sequence of the main points, evidence, and actions. Storyboarding helps the team to organize their thoughts, identify gaps, and communicate their findings in a clear and compelling way12Reference: 1: Developing Key Messages for Effective Communication - MSKTC 2: 11 Ways Highly Successful Leaders Support Their Team - Redbooth Storyboarding is a technique that helps the team to develop the appropriate messages to support their recommendations by creating a visual sequence of the main points, evidence, and actions. Storyboarding helps the team to organize their thoughts, identify gaps, and communicate their findings in a clear and compelling way12
Reference: 1: Developing Key Messages for Effective Communication - MSKTC 2: 11 Ways Highly Successful Leaders Support Their Team - Redbooth
Question 10
A large number of text messages are received by Twitter each year making Twitter one example of Big Data. What data characteristic represents this large number of text messages?
- Veracity
- Velocity
- Value
- Variety
Correct answer: B
Explanation:
Velocity is one of the four V's of Big Data, along with Volume, Variety, and Veracity. Velocity refers to the speed at which data is generated, collected, and processed. A large number of text messages received by Twitter each year is an example of high-velocity data, as it requires real-time or near-real-time processing and analysis to extract insights and value from it. High-velocity data poses challenges and opportunities for business data analytics, as it requires efficient and scalable data infrastructure, streaming analytics, and timely decision-making. Velocity is one of the four V's of Big Data, along with Volume, Variety, and Veracity. Velocity refers to the speed at which data is generated, collected, and processed. A large number of text messages received by Twitter each year is an example of high-velocity data, as it requires real-time or near-real-time processing and analysis to extract insights and value from it. High-velocity data poses challenges and opportunities for business data analytics, as it requires efficient and scalable data infrastructure, streaming analytics, and timely decision-making.

