File Info
| Exam | Analyzing and Visualizing Data with Microsoft Excel |
| Number | 70-779 |
| File Name | Microsoft.70-779.BrainDumps.2019-10-15.60q.tqb |
| Size | 4 MB |
| Posted | Oct 15, 2019 |
| Download | Microsoft.70-779.BrainDumps.2019-10-15.60q.tqb |
How to open VCEX & EXAM Files?
Files with VCEX & EXAM extensions can be opened by ProfExam Simulator.
Coupon: MASTEREXAM
With discount: 20%


Demo Questions
Question 1
Note: This question is part of a series of questions that present the same scenario. Each question in the series contains a unique solution that might meet the stated goals. Some question sets might have more than one correct solution, while others might not have a correct solution.
After you answer a question in this section, you will NOT be able to return to it. As a result, these questions will not appear in the review screen.
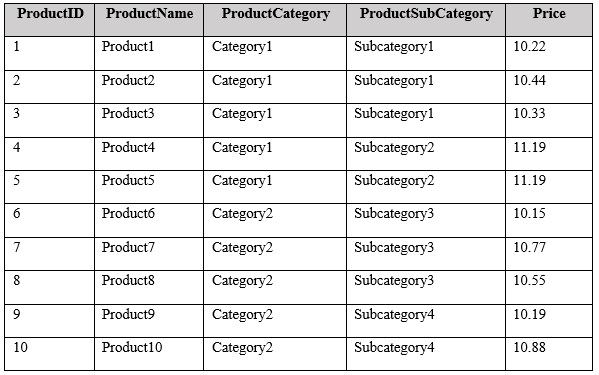
You have an Excel workbook that contains a table named Table1. A sample of the data in Table1 is shown in the following table.
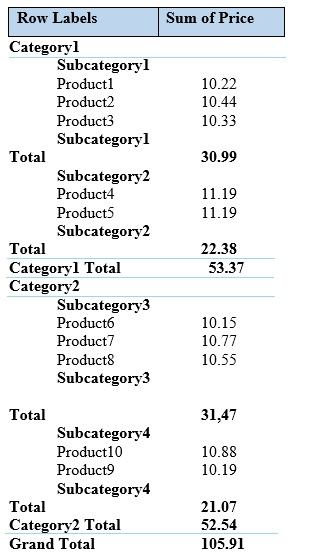
You need to create a PivotTable in PowerPivot as shown in the exhibit.
Solution: You create a hierarchy named Products that contains ProductCategory, ProductSubCategory, and ProductName. You add a PivotTable. You drag Products to the Rows field. You drag Price to the Values field.
Does this meet the goal?
- Yes
- No
Correct answer: A
Question 2
Note: This question is part of a series of questions that present the same scenario. Each question in the series contains a unique solution that might meet the stated goals. Some question sets might have more than one correct solution, while others might not have a correct solution.
After you answer a question in this section, you will NOT be able to return to it. As a result, these questions will not appear in the review screen.
You have an Excel workbook that contains a table named Table1. A sample of the data in Table1 is shown in the following table.
You need to create a PivotTable in PowerPivot as shown in the exhibit.
Solution: You add a PivotTable. You drag ProductCategory, ProductSubCategory, and ProductName to the Rows field. You drag Price to the Values field.
Does this meet the goal?
- Yes
- No
Correct answer: B
Question 3
Note: This question is part of a series of questions that present the same scenario. Each question in the series contains a unique solution that might meet the stated goals. Some question sets might have more than one correct solution, while others might not have a correct solution.
After you answer a question in this section, you will NOT be able to return to it. As a result, these questions will not appear in the review screen.
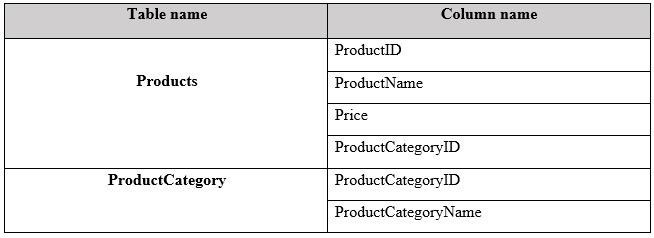
You have a Power Pivot model that contains the following tables.
There is a relationship between Products and ProductCategory.
You need to create a hierarchy in Products that contains ProductCategoryName and ProductName.
Solution: You create a measure that uses the USERELATIONSHIP DAX function.
Does this meet the goal?
- Yes
- No
Correct answer: B

