File Info
| Exam | Microsoft Azure DevOps Solutions |
| Number | AZ-400 |
| File Name | Microsoft.AZ-400.Dump4Pass.2024-06-15.434q.vcex |
| Size | 22 MB |
| Posted | Jun 15, 2024 |
| Downloads: | 10 |
| Download | Microsoft.AZ-400.Dump4Pass.2024-06-15.434q.vcex |
How to open VCEX & EXAM Files?
Files with VCEX & EXAM extensions can be opened by ProfExam Simulator.
Coupon: MASTEREXAM
With discount: 20%


Demo Questions
Question 1
You need to recommend project metrics for dashboards in Azure DevOps.
Which chart widgets should you recommend for each metric? To answer, drag the appropriate chart widgets to the correct metrics. Each chart widget may be used once, more than once, or not at all. You may need to drag the split bar between panes or scroll to view content.
NOTE: Each correct selection is worth one point.
Correct answer: To work with this question, an Exam Simulator is required.
Explanation:
Box 1: Lead time Lead time measures the total time elapsed from the creation of work items to their completion. Box 2: Cycle time Cycle time measures the time it takes for your team to complete work items once they begin actively working on them. Box 3: Burndown Burndown charts focus on remaining work within a specific time period. Incorrect Answers: Velocity provides a useful metric for these activities: Support sprint planning Forecast future sprints and the backlog items that can be completed A guide for determining how well the team estimates and meets their planned commitments Reference: https://docs.microsoft.com/en-us/azure/devops/report/dashboards/velocity-guidance?view=vstshttps://docs.microsoft.com/en-us/azure/devops/report/dashboards/cycle-time-and-lead-time?view=vsts https://docs.microsoft.com/en-us/azure/devops/report/dashboards/configure-burndown-burnup-widgets?view=vsts Box 1: Lead time
Lead time measures the total time elapsed from the creation of work items to their completion.
Box 2: Cycle time
Cycle time measures the time it takes for your team to complete work items once they begin actively working on them.
Box 3: Burndown
Burndown charts focus on remaining work within a specific time period.
Incorrect Answers:
Velocity provides a useful metric for these activities:
Support sprint planning
Forecast future sprints and the backlog items that can be completed
A guide for determining how well the team estimates and meets their planned commitments
Reference:
https://docs.microsoft.com/en-us/azure/devops/report/dashboards/velocity-guidance?view=vsts
https://docs.microsoft.com/en-us/azure/devops/report/dashboards/cycle-time-and-lead-time?view=vsts
https://docs.microsoft.com/en-us/azure/devops/report/dashboards/configure-burndown-burnup-widgets?view=vsts
Question 2
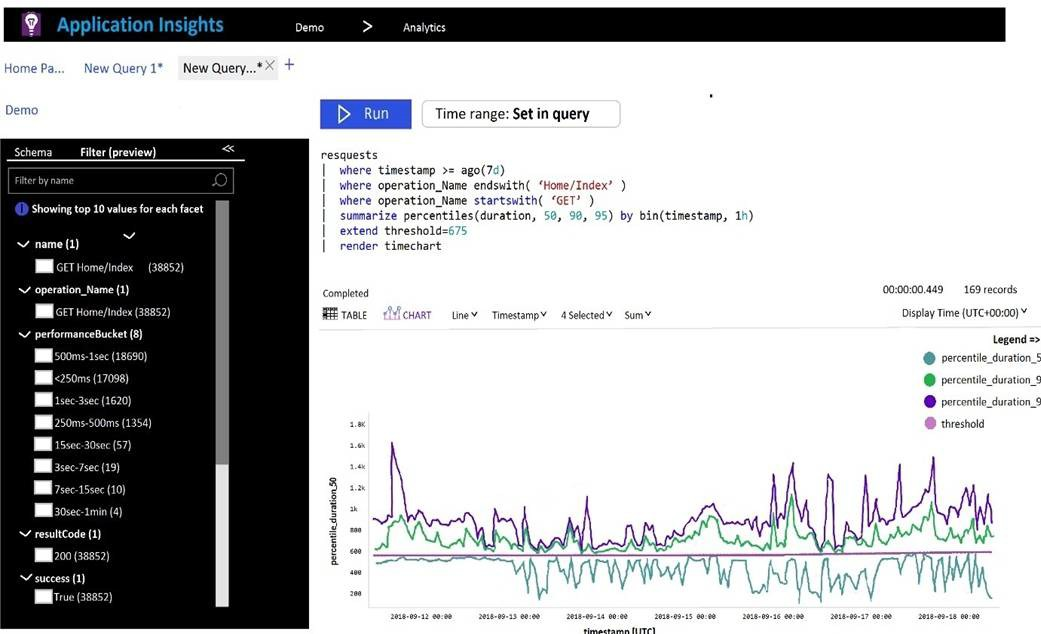
You plan to create alerts that will be triggered based on the page load performance of a home page.
You have the Application Insights log query shown in the following exhibit.
Use the drop-down menus to select the answer choice that completes each statement based on the information presented in the graphic.
NOTE: Each correct selection is worth one point.
Correct answer: To work with this question, an Exam Simulator is required.
Explanation:
Box 1: percentile_duration_95 Box 2: success For example – requests | project name, url, success | where success == "False" This will return all the failed requests in my App Insights within the specified time range. Reference: https://devblogs.microsoft.com/premier-developer/alerts-based-on-analytics-query-using-custom-log-search/ Box 1: percentile_duration_95
Box 2: success
For example –
requests
| project name, url, success
| where success == "False"
This will return all the failed requests in my App Insights within the specified time range.
Reference:
https://devblogs.microsoft.com/premier-developer/alerts-based-on-analytics-query-using-custom-log-search/
Question 3
You manage an Azure web app that supports an e-commerce website.
You need to increase the logging level when the web app exceeds normal usage patterns. The solution must minimize administrative overhead.
Which two resources should you include in the solution? Each correct answer presents part of the solution.
NOTE: Each correct selection is worth one point.
- an Azure Automation runbook
- an Azure Monitor alert that has a dynamic threshold
- an Azure Monitor alert that has a static threshold
- the Azure Monitor autoscale settings
- an Azure Monitor alert that uses an action group that has an email action
Correct answer: AB
Explanation:
B: Metric Alert with Dynamic Thresholds detection leverages advanced machine learning (ML) to learn metrics' historical behavior, identify patterns and anomalies that indicate possible service issues. It provides support of both a simple UI and operations at scale by allowing users to configure alert rules through the Azure Resource Manager API, in a fully automated manner. A: You can use Azure Monitor to monitor base-level metrics and logs for most services in Azure. You can call Azure Automation runbooks by using action groups or by using classic alerts to automate tasks based on alerts. Reference: https://docs.microsoft.com/en-us/azure/azure-monitor/platform/alerts-dynamic-thresholds https://docs.microsoft.com/en-us/azure/automation/automation-create-alert-triggered-runbook B: Metric Alert with Dynamic Thresholds detection leverages advanced machine learning (ML) to learn metrics' historical behavior, identify patterns and anomalies that indicate possible service issues. It provides support of both a simple UI and operations at scale by allowing users to configure alert rules through the Azure Resource Manager API, in a fully automated manner.
A: You can use Azure Monitor to monitor base-level metrics and logs for most services in Azure. You can call Azure Automation runbooks by using action groups or by using classic alerts to automate tasks based on alerts.
Reference:
https://docs.microsoft.com/en-us/azure/azure-monitor/platform/alerts-dynamic-thresholds
https://docs.microsoft.com/en-us/azure/automation/automation-create-alert-triggered-runbook
Question 4
You have an Azure Kubernetes Service (AKS) pod.
You need to configure a probe to perform the following actions:
- Confirm that the pod is responding to service requests.
- Check the status of the pod four times a minute.
- Initiate a shutdown if the pod is unresponsive.
How should you complete the YAML configuration file? To answer, select the appropriate options in the answer area.
NOTE: Each correct selection is worth one point.
Correct answer: To work with this question, an Exam Simulator is required.
Explanation:
Box 1: readinessProbe: For containerized applications that serve traffic, you might want to verify that your container is ready to handle incoming requests. Azure Container Instances supports readiness probes to include configurations so that your container can't be accessed under certain conditions. Incorrect Answers: livenessProbe: Containerized applications may run for extended periods of time, resulting in broken states that may need to be repaired by restarting the container. Azure Container Instances supports liveness probes so that you can configure your containers within your container group to restart if critical functionality is not working. Box 2: periodSeconds: 15 The periodSeconds property designates the readiness command should execute every 15 seconds. Reference: https://docs.microsoft.com/en-us/azure/container-instances/container-instances-readiness-probe Box 1: readinessProbe:
For containerized applications that serve traffic, you might want to verify that your container is ready to handle incoming requests. Azure Container Instances supports readiness probes to include configurations so that your container can't be accessed under certain conditions.
Incorrect Answers:
livenessProbe: Containerized applications may run for extended periods of time, resulting in broken states that may need to be repaired by restarting the container. Azure Container Instances supports liveness probes so that you can configure your containers within your container group to restart if critical functionality is not working.
Box 2: periodSeconds: 15
The periodSeconds property designates the readiness command should execute every 15 seconds.
Reference:
https://docs.microsoft.com/en-us/azure/container-instances/container-instances-readiness-probe
Question 5
You have a Microsoft ASP.NET Core web app in Azure that is accessed worldwide.
You need to run a URL ping test once every five minutes and create an alert when the web app is unavailable from specific Azure regions. The solution must minimize development time.
What should you do?
- Create an Azure Monitor Availability metric and alert.
- Create an Azure Application Insights availability test and alert.
- Write an Azure function and deploy the function to the specific regions.
- Create an Azure Service Health alert for the specific regions.
Correct answer: B
Explanation:
There are three types of Application Insights availability tests: URL ping test: a simple test that you can create in the Azure portal. Multi-step web test Custom Track Availability Tests Note: After you've deployed your web app/website, you can set up recurring tests to monitor availability and responsiveness. Azure Application Insights sends web requests to your application at regular intervals from points around the world. It can alert you if your application isn't responding, or if it responds too slowly. You can set up availability tests for any HTTP or HTTPS endpoint that is accessible from the public internet. You don't have to make any changes to the website you're testing. In fact, it doesn't even have to be a site you own. You can test the availability of a REST API that your service depends on. Reference: https://docs.microsoft.com/en-us/azure/azure-monitor/app/monitor-web-app-availability#create-a-url-ping-test There are three types of Application Insights availability tests:
- URL ping test: a simple test that you can create in the Azure portal.
- Multi-step web test
- Custom Track Availability Tests
Note: After you've deployed your web app/website, you can set up recurring tests to monitor availability and responsiveness. Azure Application Insights sends web requests to your application at regular intervals from points around the world. It can alert you if your application isn't responding, or if it responds too slowly.
You can set up availability tests for any HTTP or HTTPS endpoint that is accessible from the public internet. You don't have to make any changes to the website you're testing. In fact, it doesn't even have to be a site you own. You can test the availability of a REST API that your service depends on.
Reference:
https://docs.microsoft.com/en-us/azure/azure-monitor/app/monitor-web-app-availability#create-a-url-ping-test
Question 6
You have a multi-tier application. The front end of the application is hosted in Azure App Service.
You need to identify the average load times of the application pages.
What should you use?
- Azure Application Insights
- the activity log of the App Service
- the diagnostics logs of the App Service
- Azure Advisor
Correct answer: A
Explanation:
Application Insights will tell you about any performance issues and exceptions, and help you find and diagnose the root causes. Application Insights can monitor both Java and ASP.NET web applications and services, WCF services. They can be hosted on-premises, on virtual machines, or as Microsoft Azure websites. On the client side, Application Insights can take telemetry from web pages and a wide variety of devices including iOS, Android, and Windows Store apps. Reference: https://docs.microsoft.com/en-us/azure/azure-monitor/app/web-monitor-performance Application Insights will tell you about any performance issues and exceptions, and help you find and diagnose the root causes.
Application Insights can monitor both Java and ASP.NET web applications and services, WCF services. They can be hosted on-premises, on virtual machines, or as Microsoft Azure websites.
On the client side, Application Insights can take telemetry from web pages and a wide variety of devices including iOS, Android, and Windows Store apps.
Reference:
https://docs.microsoft.com/en-us/azure/azure-monitor/app/web-monitor-performance
Question 7
You need to create an instance of Azure Application Insights named az400-9940427-main and configure the instance to receive telemetry data from an Azure web app named az400-9940427-main.
To complete this task, sign in to the Microsoft Azure portal.
- See the explanation
Correct answer: A
Explanation:
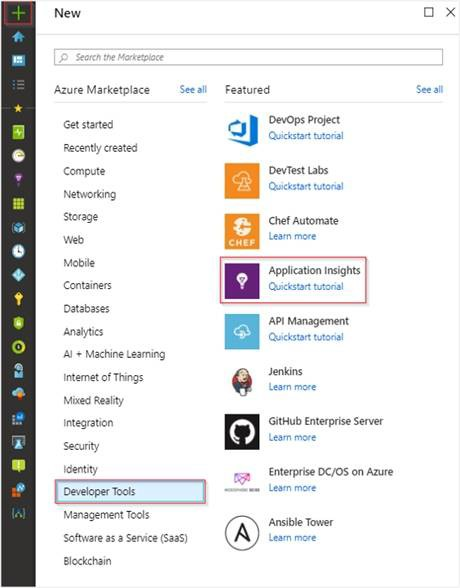
Step 1: Create an instance of Azure Application Insights 1. Open Microsoft Azure Portal 2. Log into your Azure account, Select Create a resource > Developer tools > Application Insights. 3. Enter the following settings, and then select Review + create. Name: az400-9940427-main Step 2: Configure App Insights SDK 1. Open your ASP.NET Core Web App project in Visual Studio > Right-click on the AppName in the Solution Explorer > Select Add > Application Insights Telemetry. 2. Click the Get Started button 3. Select your account and subscription > Select the Existing resource you created in the Azure portal > Click Register. Reference: https://docs.microsoft.com/bs-latn-ba/azure/azure-monitor/learn/dotnetcore-quick-start?view=vs-2017 Step 1: Create an instance of Azure Application Insights
1. Open Microsoft Azure Portal
2. Log into your Azure account, Select Create a resource > Developer tools > Application Insights.
3. Enter the following settings, and then select Review + create.
Name: az400-9940427-main
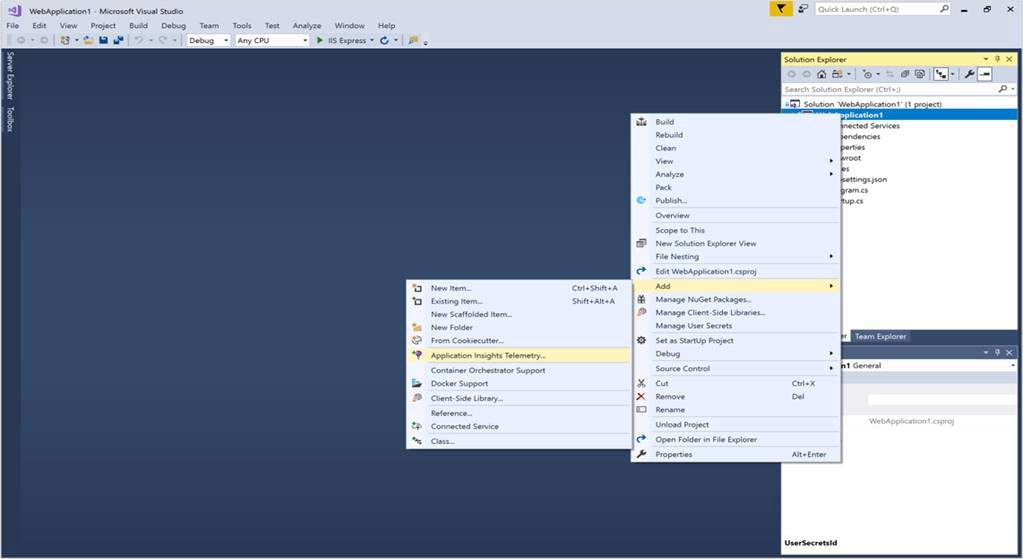
Step 2: Configure App Insights SDK
1. Open your ASP.NET Core Web App project in Visual Studio > Right-click on the AppName in the Solution Explorer > Select Add > Application Insights Telemetry.
2. Click the Get Started button
3. Select your account and subscription > Select the Existing resource you created in the Azure portal > Click Register.
Reference:
https://docs.microsoft.com/bs-latn-ba/azure/azure-monitor/learn/dotnetcore-quick-start?view=vs-2017
Question 8
Your company uses ServiceNow for incident management.
You develop an application that runs on Azure.
The company needs to generate a ticket in ServiceNow when the application fails to authenticate.
Which Azure Log Analytics solution should you use?
- Application Insights Connector
- Automation & Control
- IT Service Management Connector (ITSM)
- Insight & Analytics
Correct answer: C
Explanation:
The IT Service Management Connector (ITSMC) allows you to connect Azure and a supported IT Service Management (ITSM) product/service. ITSMC supports connections with the following ITSM tools: ServiceNow System Center Service Manager Provance Cherwell With ITSMC, you can Create work items in ITSM tool, based on your Azure alerts (metric alerts, Activity Log alerts and Log Analytics alerts). Optionally, you can sync your incident and change request data from your ITSM tool to an Azure Log Analytics workspace. Reference: https://docs.microsoft.com/en-us/azure/azure-monitor/platform/itsmc-overview The IT Service Management Connector (ITSMC) allows you to connect Azure and a supported IT Service Management (ITSM) product/service.
ITSMC supports connections with the following ITSM tools:
- ServiceNow
- System Center Service Manager
- Provance
- Cherwell
With ITSMC, you can
- Create work items in ITSM tool, based on your Azure alerts (metric alerts, Activity Log alerts and Log Analytics alerts).
- Optionally, you can sync your incident and change request data from your ITSM tool to an Azure Log Analytics workspace.
Reference:
https://docs.microsoft.com/en-us/azure/azure-monitor/platform/itsmc-overview
Question 9
Your company is building a new web application.
You plan to collect feedback from pilot users on the features being delivered.
All the pilot users have a corporate computer that has Google Chrome and the Microsoft Test & Feedback extension installed. The pilot users will test the application by using Chrome.
You need to identify which access levels are required to ensure that developers can request and gather feedback from the pilot users. The solution must use the principle of least privilege.
Which access levels in Azure DevOps should you identify? To answer, select the appropriate options in the answer area.
NOTE: Each correct selection is worth one point.
Correct answer: To work with this question, an Exam Simulator is required.
Explanation:
Box 1: Basic Assign Basic to users with a TFS CAL, with a Visual Studio Professional subscription, and to users for whom you are paying for Azure Boards & Repos in an organization. Box 2: Stakeholder Assign Stakeholders to users with no license or subscriptions who need access to a limited set of features. Note: You assign users or groups of users to one of the following access levels: Basic: provides access to most features VS Enterprise: provides access to premium features Stakeholders: provides partial access, can be assigned to unlimited users for free Reference: https://docs.microsoft.com/en-us/azure/devops/organizations/security/access-levels?view=vsts Box 1: Basic
Assign Basic to users with a TFS CAL, with a Visual Studio Professional subscription, and to users for whom you are paying for Azure Boards & Repos in an organization.
Box 2: Stakeholder
Assign Stakeholders to users with no license or subscriptions who need access to a limited set of features.
Note:
You assign users or groups of users to one of the following access levels:
Basic: provides access to most features
VS Enterprise: provides access to premium features
Stakeholders: provides partial access, can be assigned to unlimited users for free
Reference:
https://docs.microsoft.com/en-us/azure/devops/organizations/security/access-levels?view=vsts
Question 10
You use Azure SQL Database Intelligent Insights and Azure Application Insights for monitoring.
You need to write ad-hoc queries against the monitoring data.
Which query language should you use?
- Kusto Query Language (KQL)
- PL/pgSQL
- PL/SQL
- Transact-SQL
Correct answer: A
Explanation:
Azure Monitor Logs is based on Azure Data Explorer, and log queries are written using the same Kusto query language (KQL). This is a rich language designed to be easy to read and author, and you should be able to start using it with minimal guidance. Reference: https://docs.microsoft.com/en-us/azure/azure-monitor/log-query/log-query-overview Azure Monitor Logs is based on Azure Data Explorer, and log queries are written using the same Kusto query language (KQL). This is a rich language designed to be easy to read and author, and you should be able to start using it with minimal guidance.
Reference:
https://docs.microsoft.com/en-us/azure/azure-monitor/log-query/log-query-overview

