File Info
| Exam | Analyzing Data with Microsoft Power BI |
| Number | DA-100 |
| File Name | Microsoft.DA-100.Dump4Pass.2022-04-27.138q.vcex |
| Size | 31 MB |
| Posted | Apr 27, 2022 |
| Download | Microsoft.DA-100.Dump4Pass.2022-04-27.138q.vcex |
How to open VCEX & EXAM Files?
Files with VCEX & EXAM extensions can be opened by ProfExam Simulator.
Coupon: MASTEREXAM
With discount: 20%


Demo Questions
Question 1
You need to create a calculated column to display the month based on the reporting requirements.
Which DAX expression should you use?
- FORMAT('Date'[date], "MMMYYYY")
- FORMAT('Date' [date], "MYY")
- FORMAT('Date'[date_id], "MMM") & "" & FORMAT('Date'[year],"#")
- FORMAT('Date' [date_id], "MMMYYYY")
Correct answer: A
Explanation:
Corrected Scenario: In the Date table, the date_id column has a format of yyyymmdd. Users must be able to see the month in reports as shown in the following example: Feb 2020. Incorrect Answers: B: The output format should be "MMM YYYY" not "M YY" C, D: The data_id is an integer and not a Date datatype. Reference: https://docs.microsoft.com/en-us/dax/format-function-daxhttps://dax.guide/format/ Corrected
Scenario: In the Date table, the date_id column has a format of yyyymmdd. Users must be able to see the month in reports as shown in the following example: Feb 2020.
Incorrect Answers:
B: The output format should be "MMM YYYY" not "M YY"
C, D: The data_id is an integer and not a Date datatype.
Reference:
https://docs.microsoft.com/en-us/dax/format-function-daxhttps://dax.guide/format/
Question 2
You need to review the data for which there are concerns before creating the data model.
What should you do in Power Query Editor?
- Transform the sales_amount column to replace negative values with0.
- Select Columndistribution.
- Select the sales_amount column and apply a numberfilter.
- Select Column profile, and then select the sales_amountcolumn.
Correct answer: D
Explanation:
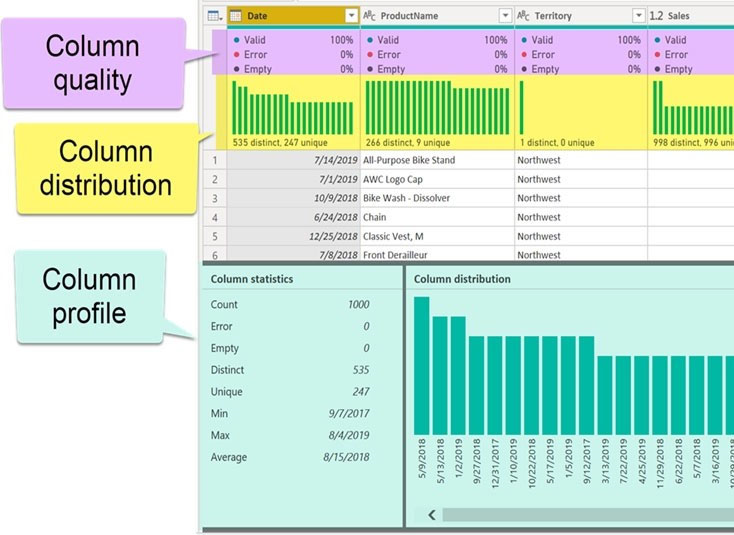
Confirm Scenario: Data Concerns You are concerned with the quality and completeness of the sales data. You plan to verify the sales data for negative sales amounts. The Column profile feature provides a more in-depth look at the data in a column. It contains a column statistics chart that displays Count, Error, Empty, Distinct, Unique, Empty String, Min, & Max of the selected column. Reference: https://docs.microsoft.com/en-us/power-query/data-profiling-toolshttps://powerbidocs.com/2021/03/02/column-quality-column-distribution-column-profile/ Confirm
Scenario: Data Concerns
You are concerned with the quality and completeness of the sales data. You plan to verify the sales data for negative sales amounts.
The Column profile feature provides a more in-depth look at the data in a column. It contains a column statistics chart that displays Count, Error, Empty, Distinct, Unique, Empty String, Min, & Max of the selected column.
Reference:
https://docs.microsoft.com/en-us/power-query/data-profiling-
toolshttps://powerbidocs.com/2021/03/02/column-quality-column-distribution-column-profile/
Question 3
What is the minimum number of Power BI datasets needed to support the reports?
- two importeddatasets
- a single DirectQuerydataset
- two DirectQuerydatasets
- a single importeddataset
Correct answer: A
Explanation:
Confirm Scenario: Data and Sources Data for the reports comes from three sources. Detailed revenue, cost, and expense data comes from an Azure SQL database. Summary balance sheet data comes from Microsoft Dynamics 365 Business Central. The balance sheet data is not related to the profit and loss results, other than they both relate dates. Monthly revenue and expense projections for the next quarter come from a Microsoft SharePoint Online list. Quarterly projections relate to the profit and loss results by using the following shared dimensions: date, business unit, department, and product category. Reference: https://docs.microsoft.com/en-us/power-bi/connect-data/service-datasets-understand Confirm
Scenario: Data and Sources
Data for the reports comes from three sources. Detailed revenue, cost, and expense data comes from an Azure SQL database. Summary balance sheet data comes from Microsoft Dynamics 365 Business Central.
The balance sheet data is not related to the profit and loss results, other than they both relate dates.
Monthly revenue and expense projections for the next quarter come from a Microsoft SharePoint Online list.
Quarterly projections relate to the profit and loss results by using the following shared dimensions: date, business unit, department, and product category.
Reference:
https://docs.microsoft.com/en-us/power-bi/connect-data/service-datasets-understand
Question 4
You have a custom connector that returns ID, From, To, Subject, Body, and Has Attachments for every email sent during the past year. More than 10 million records are returned.
You build a report analyzing the internal networks of employees based on whom they send emails to.
You need to prevent report recipients from reading the analyzed emails. The solution must minimize the model size.
What should you do?
- Implement row-level security (RLS) so that the report recipients can only see results based on the emails they sent.
- Remove the Subject and Body columns during theimport.
- From Model view, set the Subject and Body columns toHidden.
Correct answer: B
Explanation:
Confirm Incorrect Answers: A, C: Does not reduce the size of the model. Confirm
Incorrect Answers:
A, C: Does not reduce the size of the model.
Question 5
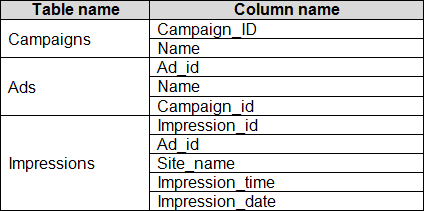
You have the tables shown in the following table.
The Impressions table contains approximately 30 million records per month.
You need to create an ad analytics system to meet the following requirements:
- Present ad impression counts for the day, campaign, and Site_name. The analytics for the last year are required.
- Minimize the data model size.
Which two actions should you perform? Each correct answer presents part of the solution.
NOTE: Each correct selection is worth one point.
- Group the impressions by Ad_id, Site_name, and Impression_date.Aggregate by using the CountRowsfunction.
- Create one-to-many relationships between thetables.
- Create a calculated measure that aggregates by using the COUNTROWSfunction.
- Create a calculated table that contains Ad_id, Site_name, andImpression_date.
Correct answer: AB
Explanation:
confirm confirm
Question 6
Your company has training videos that are published to Microsoft Stream.
You need to surface the videos directly in a Microsoft Power BI dashboard.
Which type of tile should you add?
- video
- custom streamingdata
- textbox
- webcontent
Correct answer: D
Explanation:
Corrected The only way to visualize a streaming dataset is to add a tile and use the streaming dataset as a custom streaming data source. Reference: https://docs.microsoft.com/en-us/power-bi/connect-data/service-real-time-streaming Corrected
The only way to visualize a streaming dataset is to add a tile and use the streaming dataset as a custom
streaming data source.
Reference:
https://docs.microsoft.com/en-us/power-bi/connect-data/service-real-time-streaming
Question 7
You open a query in Power Query Editor.
You need to identify the percentage of empty values in each column as quickly as possible.
Which Data Preview option should you select?
- Show whitespace
- Columnprofile
- Columndistribution
- Columnquality
Correct answer: D
Explanation:
Confirm Column quality: In this section, we can easily see valid, Error and Empty percentage of data values associated with the Selected table. Note: In Power Query Editor, Under View tab in Data Preview Section we can see the following data profiling functionalities: Column quality Column distribution Column profile Reference: https://community.powerbi.com/t5/Community-Blog/Data-Profiling-in-Power-BI-Power-BI-Update-April-2019/ba-p/674555 Confirm
Column quality: In this section, we can easily see valid, Error and Empty percentage of data values associated with the Selected table.
Note: In Power Query Editor, Under View tab in Data Preview Section we can see the following data profiling functionalities:
- Column quality
- Column distribution
- Column profile
Reference:
https://community.powerbi.com/t5/Community-Blog/Data-Profiling-in-Power-BI-Power-BI-Update-April-2019/ba-p/674555
Question 8
You have a prospective customer list that contains 1,500 rows of data. The list contains the following fields:
- First name
- Last name
- Email address
- State/Region
- Phone number
You import the list into Power Query Editor.
You need to ensure that the list contains records for each State/Region to which you want to target a marketing campaign.
Which two actions should you perform? Each correct answer presents part of the solution.
NOTE: Each correct selection is worth one point.
- Open the AdvancedEditor.
- Select Columnquality.
- Enable Column profiling based on entiredataset.
- Select Columndistribution.
- Select Columnprofile.
Correct answer: CE
Explanation:
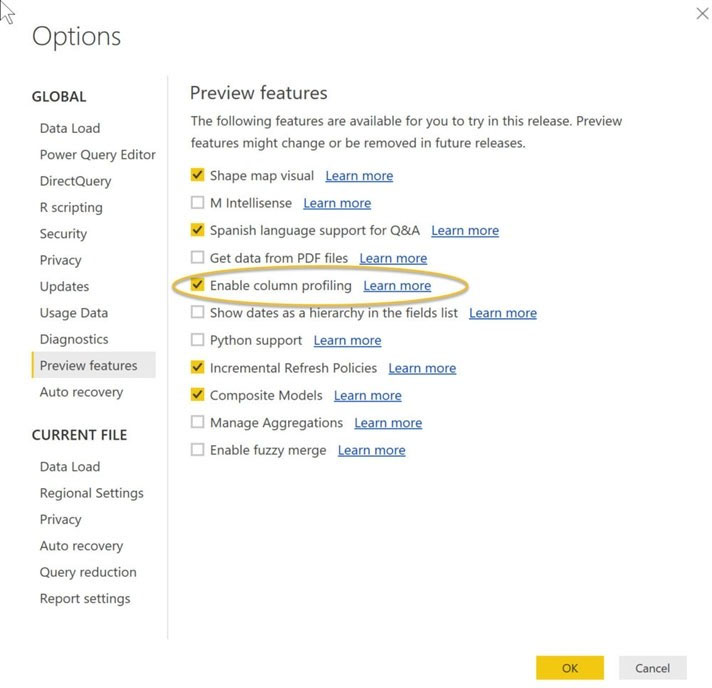
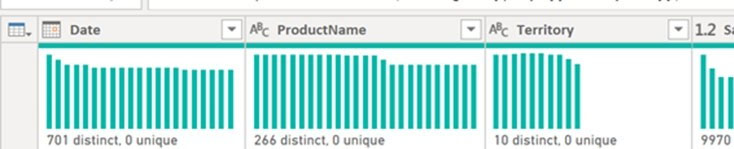
Corrected Data Profiling, Quality & Distribution in Power BI / Power Query features To enable these features, you need to go to the View tab à Data Preview Group à Check the following: Column quality Column profile Column distribution Column profile Turn on the Column Profiling feature. Column distribution Can use it to visually realize that your query is missing some data because of distinct and uniqueness counts. Reference: https://www.poweredsolutions.co/2019/08/13/data-profiling-quality-distribution-in-power-bi-power-query/ https://www.altentertraining.com/microsoft/power-bi/column-profiling-is-good/ Corrected
Data Profiling, Quality & Distribution in Power BI / Power Query features
To enable these features, you need to go to the View tab à Data Preview Group à Check the following:
- Column quality
- Column profile
- Column distribution
- Column profile
Turn on the Column Profiling feature.
- Column distribution
Can use it to visually realize that your query is missing some data because of distinct and uniqueness counts.
Reference:
https://www.poweredsolutions.co/2019/08/13/data-profiling-quality-distribution-in-power-bi-power-query/
https://www.altentertraining.com/microsoft/power-bi/column-profiling-is-good/
Question 9
You have an API that returns more than 100 columns. The following is a sample of column names.
- client_notified_timestampc
- lient_notified_sourceclien
- t_notified_sourceidclient_
- notified_valueclient_respo
- nded_timestampclient_respo
- nded_sourceclient_responde
- d_sourceidclient_responded
- _value
You plan to include only a subset of the returned columns.
You need to remove any columns that have a suffix of sourceid.
How should you complete the Power Query M code? To answer, select the appropriate options in the answer area.
NOTE: Each correct selection is worth one point.
Correct answer: To work with this question, an Exam Simulator is required.
Explanation:
Box 1: Table.RemoveColumns When you do “Remove Columns” Power Query uses the Table.RemoveColumns function Box 2: List.Select Get a list ofcolumns. Box 3:Text.EndsWith Reference: https://community.powerbi.com/t5/Power-Query/Remove-columns-containing-a-certain-value/td-p/759657 Box 1: Table.RemoveColumns
When you do “Remove Columns” Power Query uses the Table.RemoveColumns function
Box 2: List.Select
Get a list ofcolumns.
Box 3:Text.EndsWith
Reference:
https://community.powerbi.com/t5/Power-Query/Remove-columns-containing-a-certain-value/td-p/759657
Question 10
You are building a dataset from a JSON file that contains an array of documents.
You need to import attributes as columns from all the documents in the JSON file. The solution must ensure that date attributes can be used as date hierarchies in Microsoft Power BI reports.
Which three actions should you perform in sequence? To answer, move the appropriate actions from the list of actions to the answer area and arrange them in the correct order.
Correct answer: To work with this question, an Exam Simulator is required.

