File Info
| Exam | Analyzing Data with Microsoft Power BI |
| Number | DA-100 |
| File Name | Microsoft.DA-100.NewDumps.2021-04-01.105q.vcex |
| Size | 10 MB |
| Posted | Apr 01, 2021 |
| Download | Microsoft.DA-100.NewDumps.2021-04-01.105q.vcex |
How to open VCEX & EXAM Files?
Files with VCEX & EXAM extensions can be opened by ProfExam Simulator.
Coupon: MASTEREXAM
With discount: 20%


Demo Questions
Question 1
You have a table that contains sales data and approximately 1,000 rows. You need to identify outliers in the table. Which type of visualization should you use?
- area chart
- donut chart
- scatter plot
- pie chart
Correct answer: C
Question 2
You have a collection of reports for the HR department of your company. The datasets use row-level security (RLS). The company has multiple sales regions that each has an HR manager. You need to ensure that the HR managers can interact with the data from their region only. The HR managers must be prevented from changing the layout of the reports. How should you provision access to the reports for the HR managers?
Case Study Title (Case Study):
Topic 1, Contoso Ltd, Case Study
Overview
This is a case study. Case studies are not timed separately. You can use as much exam time as you would like to complete each case. However, there may be additional case studies and sections on this exam. You must manage your time to ensure that you are able to complete all questions included on this exam in the time provided.
To answer the questions included in a case study, you will need to reference information that is provided in the case study. Case studies might contain exhibits and other resources that provide more information about the scenario that is described in the case study. Each question is independent of the other questions in this case study. At the end of this case study, a review screen will appear. This screen allows you to review your answers and to make changes before you move to the next section of the exam. After you begin a new section, you cannot return to this section.
To start the case study
To display the first question in this case study, click the Next button. Use the buttons in the left pane to explore the content of the case study before you answer the questions. Clicking these buttons displays information such as business requirements, existing environment and problem statements. If the case study has an All Information tab, note that the information displayed is identical to the information displayed on the subsequent tabs. When you are ready to answer a question, click the Question button to return to the question.
Existing Environment
Contoso, Ltd. is a manufacturing company that produces outdoor equipment Contoso has quarterly board meetings for which financial analysts manually prepare Microsoft Excel reports, including profit and loss statements for each of the company's four business units, a company balance sheet, and net income projections for the next quarter.
Data and Sources
Data for the reports comes from three sources. Detailed revenue, cost and expense data comes from an Azure SQL database. Summary balance sheet data comes from Microsoft Dynamics 365 Business Central. The balance sheet data is not related to the profit and loss results, other than they both relate to dates.
Monthly revenue and expense projections for the next quarter come from a Microsoft SharePoint Online list.
Quarterly projections relate to the profit and loss results by using the following shared dimensions:
date, business unit, department, and product category.
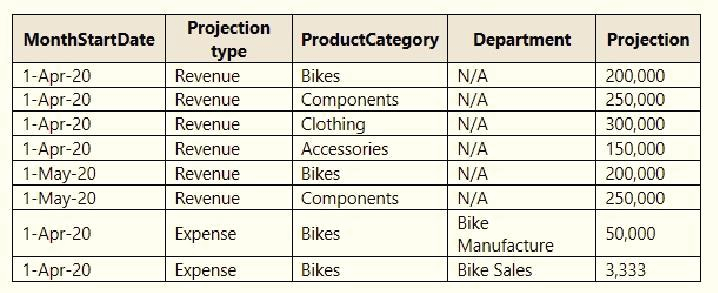
Net Income Projection Data
Net income projection data is stored in a SharePoint Online list named Projections in the format shown in the following table.
Revenue projections are set at the monthly level and summed to show projections for the quarter.
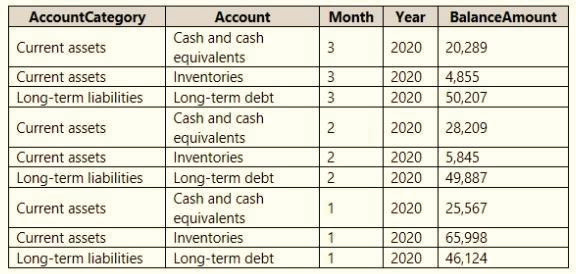
Balance Sheet Data
The balance sheet data is imported with final balances for each account per month in the format shown in the following table.
There is always a row for each account for each month in the balance sheet data.
Dynamics 365 Business Central Data
Business Central contains a product catalog that shows how products roll up to product categories, which roll up to business units. Revenue data is provided at the date and product level. Expense data is provided at the date and department level.
Business Issues
Historically, it has taken two analysts a week to prepare the reports for the quarterly board meetings. Also, there is usually at least one issue each quarter where a value in a report is wrong because of a bad cell reference in an Excel formula. On occasion, there are conflicting results in the reports because the products and departments that roll up to each business unit are not defined consistently.
Planned Changes
Contoso plans to automate and standardize the quarterly reporting process by using Microsoft Power Bl. The company wants to how long it takes to populate reports to less than two days. The company wants to create common logic for business units, products, and departments to be used across all reports, including, but not limited, to the quarterly reporting for the board.
Technical Requirements
Contoso wants the reports and datasets refreshed with minimal manual effort The company wants to provide a single package of reports to the board that contains custom navigation and links to supplementary information.
Maintenance, including manually updating data and access, must be minimized as much as possible.
Security Requirements
The reports must be made available to the board from powerbi.com. A mail-enabled security group will be used to share information with the board.
The analysts responsible for each business unit must see all the data the board sees, except the profit and loss data, which must be restricted to only their business unit's data. The analysts must be able to build new reports from the dataset that contains the profit and loss data, but any reports that the analysts build must not be included in the quarterly reports for the board. The analysts must not be able to share the quarterly reports with anyone.
Report Requirements
You plan to relate the balance sheet to a standard date table in Power Bl in a many-to-one relationship based on the last day of the month. At least one of the balance sheet reports in the quarterly reporting package must show the ending balances for the quarter, as well as for the previous quarter.
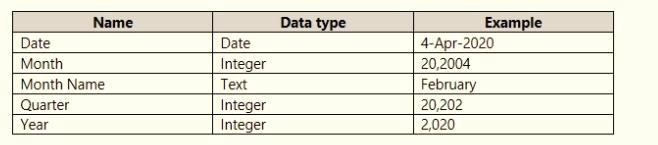
Projections must contain a column named RevenueProjection that contains the revenue projection amounts. A relationship must be created from Projections to a table named Date that contains the columns shown in the following table.
The relationships between products and departments to business units must be consistent across all reports.
The board must be able to get the following information from the quarterly reports:
- Revenue trends over time
- Ending balances for each account
- A comparison of expenses versus projections by quarter
- Changes in long-term liabilities from the previous quarter
- A comparison of quarterly revenue versus the same quarter during the prior year
- Create a new workspace, copy the datasets and reports, and add the HR managers as members of the workspace.
- Publish the reports to a different workspace other than the one hosting the datasets.
- Publish the reports in an app and grant the HR managers access permission.
- Add the HR managers as members of the existing workspace that hosts the reports and the datasets.
Correct answer: D
Question 3
You have a Microsoft Power BI data model that contains three tables named Orders, Date, and City. There is a one-to-many relationship between Date and Orders and between City and Orders. The model contains two row-level security (RLS) roles named Role1 and Role2. Role1 contains the following filter.
City[State Province] = "Kentucky"
Role2 contains the following filter.
Date[Calendar Year] = 2020
If a user is a member of both Role1 and Role2, what data will they see in a report that uses the model?
- The user will see data for which the State Province value is Kentucky and the Calendar Year is 2020.
- The user will see data for which the State Province value is Kentucky or the Calendar Year is 2020.
- The user will see only data for which the State Province value is Kentucky.
- The user will receive an error and will not be able to see the data in the report.
Correct answer: B
Explanation:
When a report user is assigned to multiple roles, RLS filters become additive. It means report users can see table rows that represent the union of those filters. Reference:https://docs.microsoft.com/en-us/power-bi/guidance/rls-guidance When a report user is assigned to multiple roles, RLS filters become additive. It means report users can see table rows that represent the union of those filters.
Reference:
https://docs.microsoft.com/en-us/power-bi/guidance/rls-guidance
Question 4
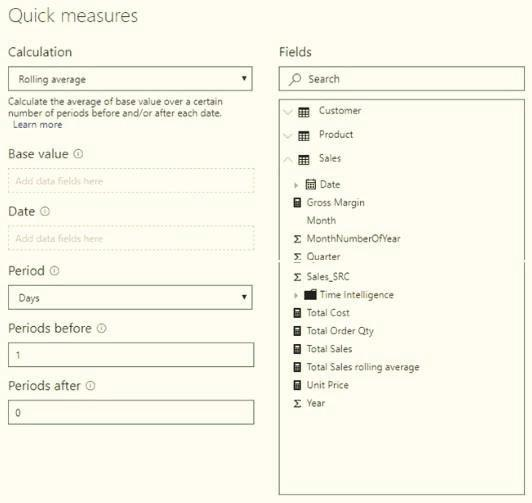
You are creating a quick measure as shown in the following exhibit.
You need to create a monthly rolling average measure for Sales over time-How should you configure the quick measure calculation? To answer, select the appropriate options in the answer area.
NOTE: Each correct selection is worth one point.
Correct answer: To work with this question, an Exam Simulator is required.
Explanation:
Box 1: Total SalesWe select the field Total Sales Box 2: DateSelect a date field. Box 3: MonthMonthly periods. Reference:https://docs.microsoft.com/en-us/power-bi/transform-model/desktop-quick-measures Box 1: Total Sales
We select the field Total Sales
Box 2: Date
Select a date field.
Box 3: Month
Monthly periods.
Reference:
https://docs.microsoft.com/en-us/power-bi/transform-model/desktop-quick-measures
Question 5
Note: This question is part of a series of questions that present the same scenario. Each question in the series contains a unique solution that might meet the stated goals. Some question sets might have more than one correct solution, while others might not have a correct solution. After you answer a question in this section, you will NOT be able to return to it. As a result, these questions will not appear in the review screen. You are deling data by using Microsoft Power Bl. Part of the data model is a large Microsoft SQL Server table named Order that has more than 100 million records. During the development process, you need to import a sample of the data from the Order table. Solution: You add a report-level filter that filters based on the order date. Does this meet the goal?
- Yes
- No
Correct answer: B
Question 6
You have multiple dashboards. You need to ensure that when users browse the available dashboards from powerbi.com. they can see which dashboards contain Personally Identifiable Information (Pll). The solution must minimize configuration effort and impact on the dashboard design.
What should you use?
- Active Directory groups
- tiles
- data classifications
- comments
Correct answer: A
Question 7
You create the following step by using Power Query Editor. = Table.ReplaceValue (SalesLT_Address,"1318","1319",Replacer.ReplaceText,{"AddressLine1"}) A row has a value of 21318 Lasalle Street in the AddressLine1 column. What will the value be when the step is applied?
- 1318
- 1319
- 21318 Lasalle Street
- 21319 Lasalle Street
Correct answer: C
Question 8
Note: This question is part of a series of questions that present the same scenario. Each question in the series contains a unique solution that might meet the stated goals. Some question sets might have more than one correct solution, while others might not have a correct solution. After you answer a question in this scenario, you will NOT be able to return to it. As a result, these questions will not appear in the review screen.
You have a clustered bar chart that contains a measure named Salary as the value and a field named Employee as the axis. Salary is present in the data as numerical amount representing US dollars. You need to create a reference line to show which employees are above the median salary. Solution: You create a percentile line by using the Salary measure and set the percentile to 50%.
Does this meet the goal?
- Yes
- No
Correct answer: A
Explanation:
The 50th percentile is also known as the median or middle value where 50 percent of observations fall below. Reference:https://dash-intel.com/powerbi/statistical_functions_percentile.php The 50th percentile is also known as the median or middle value where 50 percent of observations fall below.
Reference:
https://dash-intel.com/powerbi/statistical_functions_percentile.php
Question 9
You need to grant access to the business unit analysts. What should you configure? To answer, select the appropriate options in the answer area.
NOTE: Each correct selection is worth one point.
Correct answer: To work with this question, an Exam Simulator is required.
Question 10
You have a CSV file that contains user complaints. The file contains a column named Logged. Logged contains the date and time each compliant occurred. The data in Logged is in the following format:2018-12-31 at 08:59. You need to be able to analyze the complaints by the logged date and use a built-in date hierarchy.
What should you do?
- Change the data type of the Logged column to
- Apply a transform to extract the last 11 characters of the Logged column and set the data type of the new column to Date.
- Create a column by example that starts with 2018-12-31 and set the data type of the new column to Date.
- Apply a transform to extract the first 11 characters of the Logged column.
Correct answer: D
Explanation:
With Power Query you can Split Date and Time into Separate Columns by using a transform. Reference:https://www.exceljetconsult.com.ng/home/blog/power-query-split-date-and-time-into-separate-columns/ With Power Query you can Split Date and Time into Separate Columns by using a transform.
Reference:
https://www.exceljetconsult.com.ng/home/blog/power-query-split-date-and-time-into-separate-columns/

