File Info
| Exam | Analyzing Data with Microsoft Power BI |
| Number | DA-100 |
| File Name | Microsoft.DA-100.VCEplus.2020-11-23.41q.vcex |
| Size | 2 MB |
| Posted | Nov 23, 2020 |
| Download | Microsoft.DA-100.VCEplus.2020-11-23.41q.vcex |
How to open VCEX & EXAM Files?
Files with VCEX & EXAM extensions can be opened by ProfExam Simulator.
Coupon: MASTEREXAM
With discount: 20%


Demo Questions
Question 1
You need to create a calculated column to display the month based on the reporting requirements.
Which DAX expression should you use?
- FORMAT('Date'[date], "MMM YYYY")
- FORMAT('Date' [date], "M YY")
- FORMAT('Date'[date_id], "MMM") & "" & FORMAT('Date'[year], "#")
- FORMAT('Date' [date_id], "MMM YYYY")
Correct answer: D
Explanation:
Scenario: In the Date table, the date_id column has a format of yyyymmdd. Users must be able to see the month in reports as shown in the following example: Feb 2020. Scenario: In the Date table, the date_id column has a format of yyyymmdd. Users must be able to see the month in reports as shown in the following example: Feb 2020.
Question 2
What is the minimum number of datasets and storage modes required to support the reports?
- two imported datasets
- a single DirectQuery dataset
- two DirectQuery datasets
- a single imported dataset
Correct answer: A
Explanation:
Scenario: Data and SourcesData for the reports comes from three sources. Detailed revenue, cost, and expense data comes from an Azure SQL database. Summary balance sheet data comes from Microsoft Dynamics 365 Business Central. The balance sheet data is not related to the profit and loss results, other than they both relate dates.Monthly revenue and expense projections for the next quarter come from a Microsoft SharePoint Online list. Quarterly projections relate to the profit and loss results by using the following shared dimensions: date, business unit, department, and product category.Reference:https://docs.microsoft.com/en-us/power-bi/connect-data/service-datasets-understand Scenario: Data and Sources
Data for the reports comes from three sources. Detailed revenue, cost, and expense data comes from an Azure SQL database. Summary balance sheet data comes from Microsoft Dynamics 365 Business Central. The balance sheet data is not related to the profit and loss results, other than they both relate dates.
Monthly revenue and expense projections for the next quarter come from a Microsoft SharePoint Online list. Quarterly projections relate to the profit and loss results by using the following shared dimensions: date, business unit, department, and product category.
Reference:
https://docs.microsoft.com/en-us/power-bi/connect-data/service-datasets-understand
Question 3
You have the following three versions of an Azure SQL database:
- Test
- Production
- Development
You have a dataset that uses the development database as a data source.
You need to configure the dataset so that you can easily change the data source between the development, test, and production database servers from powerbi.com.
Which should you do?
- Create a JSON file that contains the database server names. Import the JSON file to the dataset.
- Create a parameter and update the queries to use the parameter.
- Create a query for each database server and hide the development tables.
- Set the data source privacy level to Organizational and use the ReplaceValue Power Query M function.
Correct answer: D
Explanation:
With privacy level settings, you can specify an isolation level that defines the degree that one data source must be isolated from other data sources.An Organizational data source limits the visibility of a data source to a trusted group of people. An Organizational data source is isolated from all Public data sources, but is visible to other Organizational data sources.Reference:https://docs.microsoft.com/en-us/power-bi/admin/desktop-privacy-levels With privacy level settings, you can specify an isolation level that defines the degree that one data source must be isolated from other data sources.
An Organizational data source limits the visibility of a data source to a trusted group of people. An Organizational data source is isolated from all Public data sources, but is visible to other Organizational data sources.
Reference:
https://docs.microsoft.com/en-us/power-bi/admin/desktop-privacy-levels
Question 4
You have a large dataset that contains more than 1 million rows. The table has a datetime column named Date.
You need to reduce the size of the data model.
What should you do?
- Round the hour of the Date column to startOfHour.
- Change the data type of the Date column to Text.
- Trim the Date column.
- Split the Date column into two columns, one that contains only the time and another that contains only the date.
Correct answer: D
Explanation:
Explanation: We have to separate date & time tables. Also, we don't need to put the time into the date table, because the time is repeated every day.Split your DateTime column into a separate date & time columns in fact table, so that you can join the date to the date table & the time to the time table. The time need to be converted to the nearest round minute or second so that every time in your data corresponds to a row in your time table.Reference: https://intellipaat.com/community/6461/how-to-include-time-in-date-hierarchy-in-power-bi Explanation: We have to separate date & time tables. Also, we don't need to put the time into the date table, because the time is repeated every day.
Split your DateTime column into a separate date & time columns in fact table, so that you can join the date to the date table & the time to the time table. The time need to be converted to the nearest round minute or second so that every time in your data corresponds to a row in your time table.
Reference: https://intellipaat.com/community/6461/how-to-include-time-in-date-hierarchy-in-power-bi
Question 5
You have a custom connector that returns ID, From, To, Subject, Body, and Has Attachments for every email sent during the past year. More than 10 million records are returned.
You build a report analyzing the internal networks of employees based on whom they send emails to.
You need to prevent report recipients from reading the analyzed emails. The solution must minimize the model size.
What should you do?
- Implement row-level security (RLS) so that the report recipients can only see results based on the emails they sent.
- Remove the Subject and Body columns during the import.
- From Model view, set the Subject and Body columns to Hidden.
Correct answer: B
Explanation:
Incorrect Answers:A, C: Does not reduce the size of the model. Incorrect Answers:
A, C: Does not reduce the size of the model.
Question 6
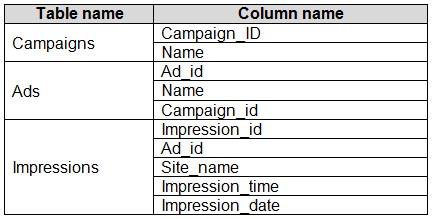
You have the tables shown in the following table.
The Impressions table contains approximately 30 million records per month.
You need to create an ad analytics system to meet the following requirements:
- Present ad impression counts for the day, campaign, and Site_name. The analytics for the last year are required.
- Minimize the data model size.
Which two actions should you perform? Each correct answer presents part of the solution.
NOTE: Each correct selection is worth one point.
- Group the impressions by Ad_id, Site_name, and Impression_date.Aggregate by using the CountRows function.
- Create one-to-many relationships between the tables.
- Create a calculated measure that aggregates by using the COUNTROWS function.
- Create a calculated table that contains Ad_id, Site_name, and Impression_date.
Correct answer: AB
Question 7
Your company has training videos that are published to Microsoft Stream.
You need to surface the videos directly in a Microsoft Power BI dashboard.
Which type of tile should you add?
- video
- custom streaming data
- text box
- web content
Correct answer: B
Explanation:
The only way to visualize a streaming dataset is to add a tile and use the streaming dataset as a custom streaming data source.Reference:https://docs.microsoft.com/en-us/power-bi/connect-data/service-real-time-streaming The only way to visualize a streaming dataset is to add a tile and use the streaming dataset as a custom streaming data source.
Reference:
https://docs.microsoft.com/en-us/power-bi/connect-data/service-real-time-streaming
Question 8
You open a query in Power Query Editor.
You need to identify the percentage of empty values in each column as quickly as possible.
Which Data Preview option should you select?
- Show whitespace
- Column profile
- Column distribution
- Column quality
Correct answer: D
Explanation:
Column quality: In this section, we can easily see valid, Error and Empty percentage of data values associated with the Selected table.Note: In Power Query Editor, Under View tab in Data Preview Section we can see the following data profiling functionalities:Column quality Column distribution Column profileReference: https://community.powerbi.com/t5/Community-Blog/Data-Profiling-in-Power-BI-Power-BI-Update-April-2019/ba-p/674555 Column quality: In this section, we can easily see valid, Error and Empty percentage of data values associated with the Selected table.
Note: In Power Query Editor, Under View tab in Data Preview Section we can see the following data profiling functionalities:
- Column quality
- Column distribution
- Column profile
Reference: https://community.powerbi.com/t5/Community-Blog/Data-Profiling-in-Power-BI-Power-BI-Update-April-2019/ba-p/674555
Question 9
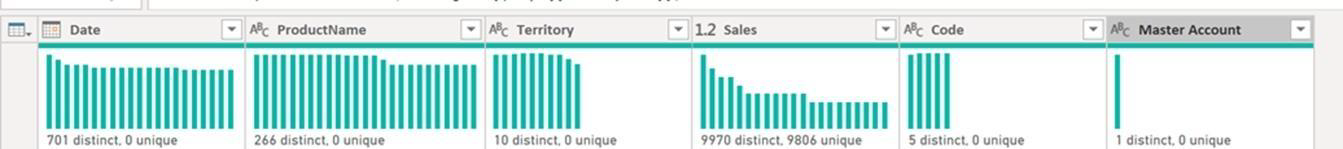
You have a prospective customer list that contains 1,500 rows of data. The list contains the following fields:
- First name
- Last name
- Email address
- State/Region
- Phone number
You import the list into Power Query Editor.
You need to ensure that the list contains records for each State/Region to which you want to target a marketing campaign.
Which two actions should you perform? Each correct answer presents part of the solution.
NOTE: Each correct selection is worth one point.
- Open the Advanced Editor.
- Select Column quality.
- Enable Column profiling based on entire dataset.
- Select Column distribution.
- Select Column profile.
Correct answer: DE
Explanation:
Data Profiling, Quality & Distribution in Power BI / Power Query featuresTo enable these features, you need to go to the View tab à Data Preview Group à Check the following:Column qualityColumn profile Column distribution Column profileTurn on the Column Profiling feature. Can use it to visually realize that your query is missing some data because of distinct and uniqueness counts. Reference:https://www.poweredsolutions.co/2019/08/13/data-profiling-quality-distribution-in-power-bi-power-query/ https://www.altentertraining.com/microsoft/power-bi/column-profiling-is-good/Column distributionColumn distribution Data Profiling, Quality & Distribution in Power BI / Power Query features
To enable these features, you need to go to the View tab à Data Preview Group à Check the following:
- Column quality
- Column profile
- Column distribution
- Column profile
Turn on the Column Profiling feature.
Can use it to visually realize that your query is missing some data because of distinct and uniqueness counts.
Reference:
https://www.poweredsolutions.co/2019/08/13/data-profiling-quality-distribution-in-power-bi-power-query/ https://www.altentertraining.com/microsoft/power-bi/column-profiling-is-good/
Column distribution
Column distribution
Question 10
You import two Microsoft Excel tables named Customer and Address into Power Query. Customer contains the following columns:
- Customer ID
- Customer Name
- Phone
- Email Address
- Address ID
Address contains the following columns:
- Address ID
- Address Line 1
- Address Line 2
- City
- State/Region
- Country
- Postal Code
The Customer ID and Address ID columns represent unique rows.
You need to create a query that has one row per customer. Each row must contain City, State/Region, and Country for each customer.
What should you do?
- Merge the Customer and Address tables.
- Transpose the Customer and Address tables.
- Group the Customer and Address tables by the Address ID column.
- Append the Customer and Address tables.
Correct answer: A
Explanation:
There are two primary ways of combining queries: merging and appending.When you have one or more columns that you'd like to add to another query, you merge the queries.When you have additional rows of data that you'd like to add to an existing query, you append the query.Reference: https://docs.microsoft.com/en-us/power-bi/connect-data/desktop-shape-and-combine-data There are two primary ways of combining queries: merging and appending.
- When you have one or more columns that you'd like to add to another query, you merge the queries.
- When you have additional rows of data that you'd like to add to an existing query, you append the query.
Reference: https://docs.microsoft.com/en-us/power-bi/connect-data/desktop-shape-and-combine-data

