File Info
| Exam | Microsoft Azure Data Fundamentals |
| Number | DP-900 |
| File Name | Microsoft.DP-900.CertDumps.2022-08-26.161q.tqb |
| Size | 9 MB |
| Posted | Aug 26, 2022 |
| Download | Microsoft.DP-900.CertDumps.2022-08-26.161q.tqb |
How to open VCEX & EXAM Files?
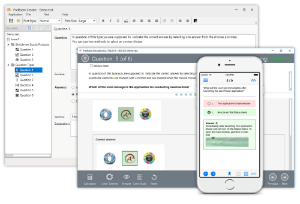
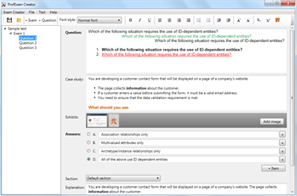
Files with VCEX & EXAM extensions can be opened by ProfExam Simulator.
Coupon: MASTEREXAM
With discount: 20%
Demo Questions
Question 1
You need to ensure that users use multi-factor authentication (MFA) when connecting to an Azure SQL database.
Which type of authentication should you use?
- service principal authentication
- Azure Active Directory (Azure AD) authentication
- SQL authentication
- certificate authentication
Correct answer: B
Explanation:
https://docs.microsoft.com/en-us/azure/azure-sql/database/authentication-mfa-ssms-overview https://docs.microsoft.com/en-us/azure/azure-sql/database/authentication-mfa-ssms-overview
Question 2
What is a benefit of hosting a database on Azure SQL managed instance as compared to an Azure SQL database?
- built-in high availability
- native support for cross-database queries and transactions
- system-initiated automatic backups
- support for encryption at rest
Correct answer: B
Explanation:
https://docs.microsoft.com/en-us/azure/azure-sql/database/features-comparison https://docs.microsoft.com/en-us/azure/azure-sql/database/features-comparison
Question 3
The visualizations on the Power BI dashboard are known as
- Canvas
- Elements
- Tiles
- Reports
Correct answer: C
Explanation:
Power BI dashboard, also known as Canvas, is a single page that tells a story with the help of visualizations.The visualizations that are present on the Power BI Dashboard are known as Tiles. Once you select a tile, you will move to the report page where that visualization was created.Option A is incorrect. Not visualizations but the Power BI dashboard is known as Canvas.Option B is incorrect. There is nothing like Elements on the Power BI dashboard.Option C is correct. The visualizations that are present on the Power BI Dashboard are known as Tiles.Option D is incorrect. The visualizations come from the reports, these are not the reports.Reference: To know more about the Visualization in Microsoft Power BI, refer to the documentation below from Azure:https://docs.microsoft.com/en-us/power-bi/consumer/end-user-dashboards Power BI dashboard, also known as Canvas, is a single page that tells a story with the help of visualizations.
The visualizations that are present on the Power BI Dashboard are known as Tiles. Once you select a tile, you will move to the report page where that visualization was created.
Option A is incorrect. Not visualizations but the Power BI dashboard is known as Canvas.
Option B is incorrect. There is nothing like Elements on the Power BI dashboard.
Option C is correct. The visualizations that are present on the Power BI Dashboard are known as Tiles.
Option D is incorrect. The visualizations come from the reports, these are not the reports.
Reference: To know more about the Visualization in Microsoft Power BI, refer to the documentation below from Azure:
https://docs.microsoft.com/en-us/power-bi/consumer/end-user-dashboards
