File Info
| Exam | Microsoft Azure Data Fundamentals |
| Number | DP-900 |
| File Name | Microsoft.DP-900.NewDumps.2021-07-30.112q.vcex |
| Size | 6 MB |
| Posted | Jul 30, 2021 |
| Download | Microsoft.DP-900.NewDumps.2021-07-30.112q.vcex |
How to open VCEX & EXAM Files?
Files with VCEX & EXAM extensions can be opened by ProfExam Simulator.
Coupon: MASTEREXAM
With discount: 20%


Demo Questions
Question 1
To complete the sentence, select the appropriate option in the answer area.
Correct answer: To work with this question, an Exam Simulator is required.
Explanation:
Reference:https://demand-planning.com/2020/01/20/the-differences-between-descriptive-diagnostic-predictivecognitive-analytics/ Reference:
https://demand-planning.com/2020/01/20/the-differences-between-descriptive-diagnostic-predictivecognitive-analytics/
Question 2
For each of the following statements, select Yes if the statement is true. Otherwise, select No.
NOTE: Each correct selection is worth one point.
Correct answer: To work with this question, an Exam Simulator is required.
Explanation:
Reference:https://www.sqlshack.com/what-is-database-normalization-in-sql-server/ Reference:
https://www.sqlshack.com/what-is-database-normalization-in-sql-server/
Question 3
To complete the sentence, select the appropriate option in the answer area.
Correct answer: To work with this question, an Exam Simulator is required.
Explanation:
In the ELT pipeline, the transformation occurs in the target data store. ELT only works well when the target system is powerful enough to transform the data efficiently.Incorrect Answers:The data does not need to be fully processed: Often, the three ETL phases are run in parallel to save time.For example, while data is being extracted, a transformation process could be working on data already received and prepare it for loading, and a loading process can begin working on the prepared data, rather than waiting for the entire extraction process to complete.The target does need to be a relational database.Reference:https://docs.microsoft.com/en-us/azure/architecture/data-guide/relational-data/etl In the ELT pipeline, the transformation occurs in the target data store. ELT only works well when the target system is powerful enough to transform the data efficiently.
Incorrect Answers:
The data does not need to be fully processed: Often, the three ETL phases are run in parallel to save time.
For example, while data is being extracted, a transformation process could be working on data already received and prepare it for loading, and a loading process can begin working on the prepared data, rather than waiting for the entire extraction process to complete.
The target does need to be a relational database.
Reference:
https://docs.microsoft.com/en-us/azure/architecture/data-guide/relational-data/etl
Question 4
To complete the sentence, select the appropriate option in the answer area.
Correct answer: To work with this question, an Exam Simulator is required.
Explanation:
Reference:https://www.bmc.com/blogs/what-is-batch-processing-batch-processing-explained/ Reference:
https://www.bmc.com/blogs/what-is-batch-processing-batch-processing-explained/
Question 5
To complete the sentence, select the appropriate option in the answer area.
Correct answer: To work with this question, an Exam Simulator is required.
Explanation:
Reference:https://azure.microsoft.com/en-us/services/cognitive-services/speech-services/ Reference:
https://azure.microsoft.com/en-us/services/cognitive-services/speech-services/
Question 6
Match the types of analytics that can be used to answer the business questions.
To answer, drag the appropriate analytics type from the column on the left to its question on the right. Each analytics type may be used once, more than once, or not at all.
NOTE: Each correct match is worth one point.
Correct answer: To work with this question, an Exam Simulator is required.
Explanation:
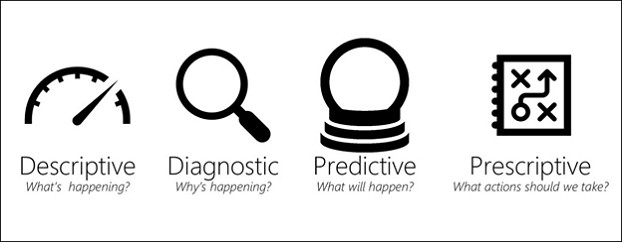
Box 1: DiagnosticDiagnostic Analytics: At this stage you can begin to answer some of those why questions. Historical data can begin to be measured against other data to answer the question of why something happened in the past. This is the process of gathering and interpreting different data sets to identify anomalies, detect patters, and determine relationships.Box 2: PrescriptivePrescriptive analytics is a combination of data, mathematical models, and various business rules to infer actions to influence future desired outcomes.Incorrect Answer:Predictive analytics, broadly speaking, is a category of business intelligence that uses descriptive and predictive variables from the past to analyze and identify the likelihood of an unknown future outcome Box 3: DescriptiveGenerally speaking, data analytics comes in four types:Descriptive, to answer the question: What's happening?Diagnostic, to answer the question: Why's happening?Predictive, to answer the question: What will happen?Prescriptive, to answer the question: What actions should we take? Reference:https://demand-planning.com/2020/01/20/the-differences-between-descriptive-diagnostic-predictivecognitive-analytics/https://azure.microsoft.com/en-us/blog/answering-whats-happening-whys-happening-and-what-will-happenwith-iot-analytics/ Box 1: Diagnostic
Diagnostic Analytics: At this stage you can begin to answer some of those why questions. Historical data can begin to be measured against other data to answer the question of why something happened in the past. This is the process of gathering and interpreting different data sets to identify anomalies, detect patters, and determine relationships.
Box 2: Prescriptive
Prescriptive analytics is a combination of data, mathematical models, and various business rules to infer actions to influence future desired outcomes.
Incorrect Answer:
Predictive analytics, broadly speaking, is a category of business intelligence that uses descriptive and predictive variables from the past to analyze and identify the likelihood of an unknown future outcome
Box 3: Descriptive
Generally speaking, data analytics comes in four types:
Descriptive, to answer the question: What's happening?
Diagnostic, to answer the question: Why's happening?
Predictive, to answer the question: What will happen?
Prescriptive, to answer the question: What actions should we take?
Reference:
https://demand-planning.com/2020/01/20/the-differences-between-descriptive-diagnostic-predictivecognitive-analytics/
https://azure.microsoft.com/en-us/blog/answering-whats-happening-whys-happening-and-what-will-happenwith-iot-analytics/
Question 7
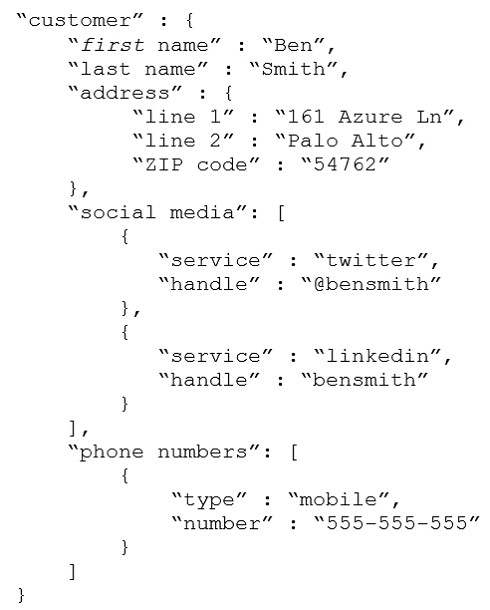
You have the following JSON document.
Use the drop-down menus to select the answer choice that completes each statement based on the information presented in the JSON document.
NOTE: Each correct selection is worth one point.
Correct answer: To work with this question, an Exam Simulator is required.
Explanation:
Reference:https://www.w3schools.com/js/js_json_arrays.asphttps://www.w3schools.com/js/js_json_objects.asp Reference:
https://www.w3schools.com/js/js_json_arrays.asp
https://www.w3schools.com/js/js_json_objects.asp
Question 8
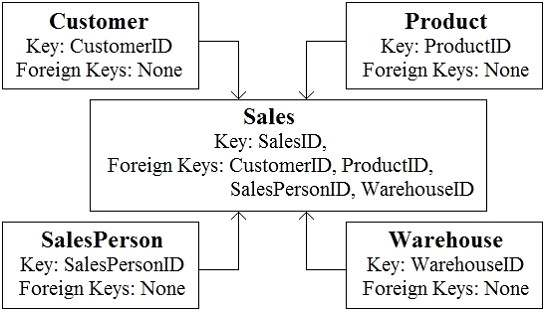
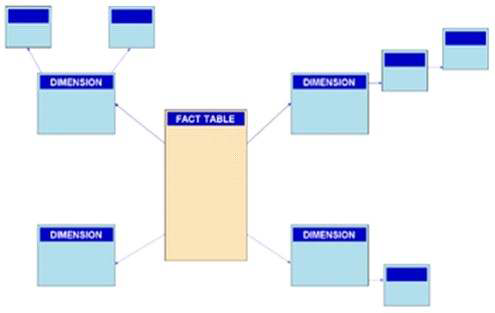
You are reviewing the data model shown in the following exhibit.
Use the drop-down menus to select the answer choice that completes each statement based on the information presented in the graphic.
NOTE: Each correct selection is worth one point
Correct answer: To work with this question, an Exam Simulator is required.
Explanation:
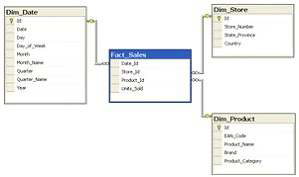
Box 1: star schemaIn computing, the star schema is the simplest style of data mart schema and is the approach most widely used to develop data warehouses and dimensional data marts. The star schema consists of one or more fact tables referencing any number of dimension tables. The star schema is an important special case of the snowflake schema, and is more effective for handling simpler queries.Example: Incorrect Answers:The data in the question is not normalized.The snowflake schema is a variation of the star schema, featuring normalization of dimension tables.Example: Note: A snowflake schema is a logical arrangement of tables in a multidimensional database such that the entity relationship diagram resembles a snowflake shape. The snowflake schema is represented by centralized fact tables which are connected to multiple dimensions.[citation needed]. "Snowflaking" is a method of normalizing the dimension tables in a star schema. When it is completely normalized along all the dimension tables, the resultant structure resembles a snowflake with the fact table in the middle.Box 2: dimensionThe star schema consists of one or more fact tables referencing any number of dimension tables.Reference:https://docs.microsoft.com/en-us/azure/synapse-analytics/sql-data-warehouse/sql-data-warehouse-tablesoverviewhttps://en.wikipedia.org/wiki/Star_schemahttps://en.wikipedia.org/wiki/Snowflake_schemahttps://azure.microsoft.com/en-us/blog/data-models-within-azure-analysis-services-and-power-bi/ Box 1: star schema
In computing, the star schema is the simplest style of data mart schema and is the approach most widely used to develop data warehouses and dimensional data marts. The star schema consists of one or more fact tables referencing any number of dimension tables. The star schema is an important special case of the snowflake schema, and is more effective for handling simpler queries.
Example:
Incorrect Answers:
The data in the question is not normalized.
The snowflake schema is a variation of the star schema, featuring normalization of dimension tables.
Example:
Note: A snowflake schema is a logical arrangement of tables in a multidimensional database such that the entity relationship diagram resembles a snowflake shape. The snowflake schema is represented by centralized fact tables which are connected to multiple dimensions.[citation needed]. "Snowflaking" is a method of normalizing the dimension tables in a star schema. When it is completely normalized along all the dimension tables, the resultant structure resembles a snowflake with the fact table in the middle.
Box 2: dimension
The star schema consists of one or more fact tables referencing any number of dimension tables.
Reference:
https://docs.microsoft.com/en-us/azure/synapse-analytics/sql-data-warehouse/sql-data-warehouse-tablesoverview
https://en.wikipedia.org/wiki/Star_schema
https://en.wikipedia.org/wiki/Snowflake_schema
https://azure.microsoft.com/en-us/blog/data-models-within-azure-analysis-services-and-power-bi/
Question 9
To complete the sentence, select the appropriate option in the answer area.
Correct answer: To work with this question, an Exam Simulator is required.
Explanation:
Reference:https://docs.microsoft.com/en-us/azure/synapse-analytics/sql-data-warehouse/massively-parallelprocessing-mpp-architecture Reference:
https://docs.microsoft.com/en-us/azure/synapse-analytics/sql-data-warehouse/massively-parallelprocessing-mpp-architecture
Question 10
To complete the sentence, select the appropriate option in the answer area.
Correct answer: To work with this question, an Exam Simulator is required.
Explanation:
Reference:https://docs.microsoft.com/en-us/sql/relational-databases/indexes/clustered-and-nonclustered-indexesdescribed?view=sql-server-ver15 Reference:
https://docs.microsoft.com/en-us/sql/relational-databases/indexes/clustered-and-nonclustered-indexesdescribed?view=sql-server-ver15

